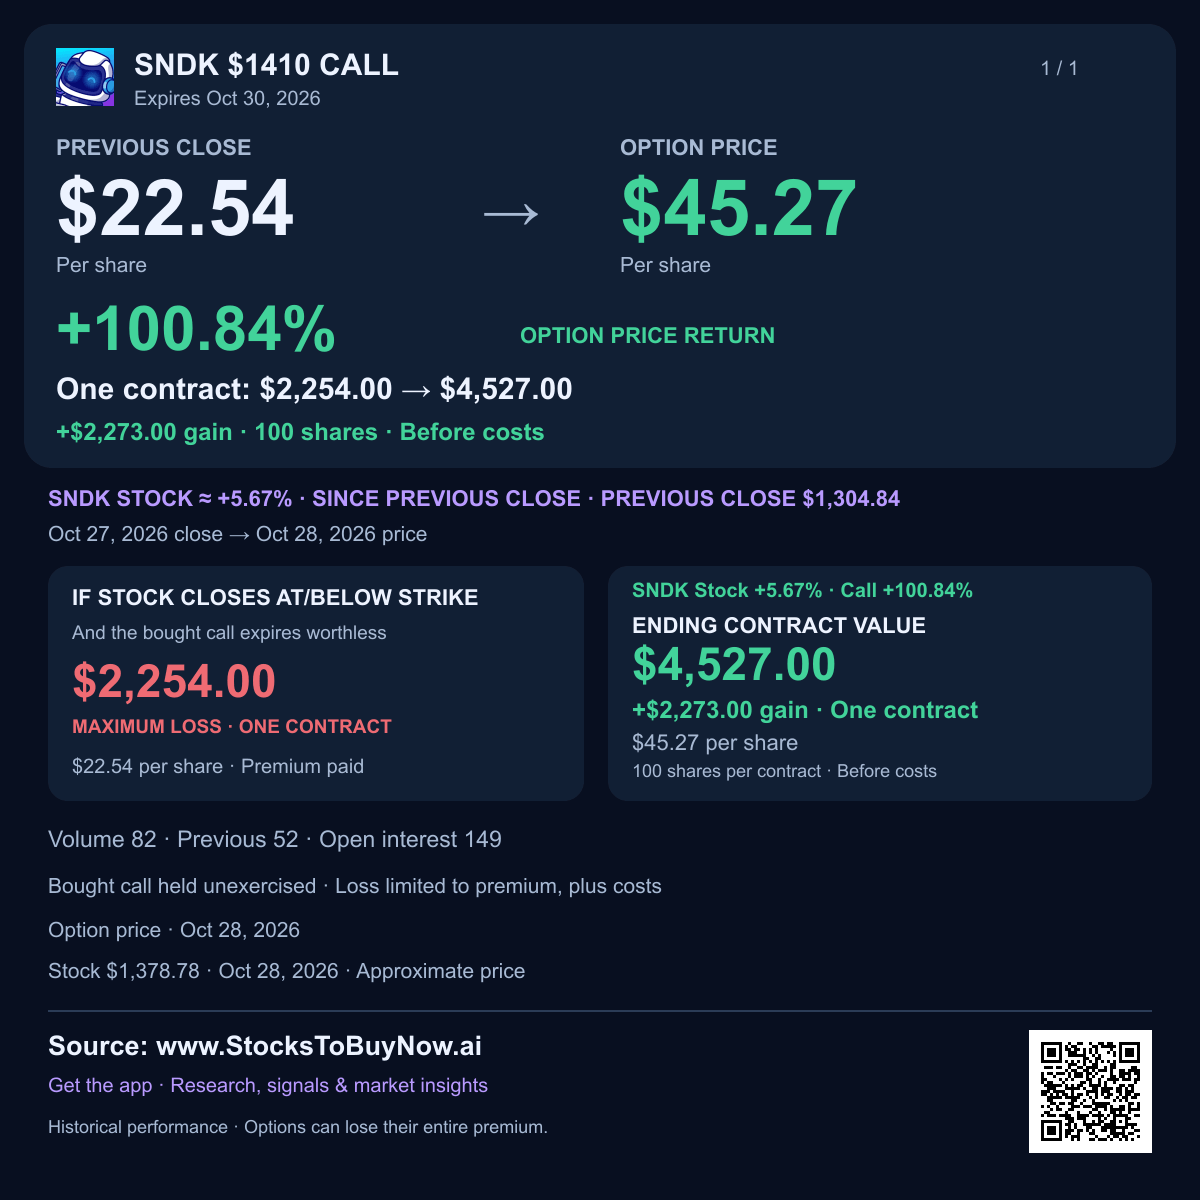
Sandisk falls despite an earnings beat as technology shares retreat
Earnings results
- EPS beat +4.9%
Adjusted: $49.51 · Consensus: $47.20, before announced split
- Revenue beat +4.3%
Actual: $11.031B · Consensus: $10.58B
- Guidance above revenue consensus
Issued Q2 sales: $12.2–$12.6B · Consensus: $12.0B
Earnings and the stock move
Sandisk declined during the October 30 technology sell-off even though its newly released fiscal first-quarter earnings and sales topped forecasts. The company’s data-center sales rose much faster than consumer sales, and its next-quarter revenue outlook exceeds consensus. That puts the investor focus on whether enterprise demand and unusually high margins can last through the memory cycle. The broad sell-off is reported market context; Sandisk did not announce a profit warning or cut this newly issued outlook.
Q1 FY2027 ended October 2 earnings recap
Sandisk fell 14.1% during trading on October 30 despite an earnings beat and a stronger sales outlook. A broad technology sell-off overshadowed its data-center growth.
- Adjusted earnings per share, or profit per share, were $49.51 versus the $47.2 forecast, a 4.9% beat. GAAP earnings were $52.6; these figures are before the announced stock split.
- Revenue reached $11.03 billion versus the $10.58 billion forecast, a 4.3% beat. Sales rose 23% from the previous quarter.
- Data-center sales rose 61% from the prior quarter to $4.8 billion, while consumer sales fell 29%. Growth is becoming more dependent on enterprise storage demand.
- The next-quarter sales outlook of $12.2–$12.6 billion exceeds the $12 billion forecast. Sandisk expects adjusted profit of $55–$57 per share before the split.
- Adjusted gross margin was 85.1%, the share of sales left after production costs. The next-quarter range of 84.5%–85.5% makes sustaining that profitability a key test.
- An eight-for-one stock split is expected to begin trading on November 20. More shares at a proportionally lower price do not increase the company’s value or a holder’s ownership percentage.
Watch whether data-center orders keep supporting sales and cash flow. Memory prices and customer spending can turn quickly, and an earnings beat alone does not protect the stock from a sell-off.
Financials and technicals
Charts through Oct 29, 2026. The session move above may reflect later news.
Technical setup and risks
October 30 trading fell below the October 23–26 lows around $1,230–$1,260. A sustained recovery above that area would repair part of the breakdown; remaining below it would keep the rebound fragile. The attached charts end at the October 29 regular close before earnings, with earlier support now above the live price.
AI-assisted research with source and calculation checks. Prices may be delayed. Technical charts use the stated completed session, which can precede the quoted intraday move. Educational information; investing involves risk.