
Share Sandisk earnings beat forecasts as data-center growth supports a stronger sales outlook
← Stock movers news
Earnings results
Sandisk CorporationSNDK · Computer Hardware
SNDK · October 29, 2026After close · Since the same-day regular close
+1.39%Session snapshot

Sandisk earnings beat forecasts as data-center growth supports a stronger sales outlook

Earnings results

  • EPS beat +4.9%

    Adjusted: $49.51 · Consensus: $47.20, before announced split

  • Revenue beat +4.3%

    Actual: $11.031B · Consensus: $10.58B

  • Guidance above revenue consensus

    Issued Q2 sales: $12.2–$12.6B · Consensus: $12.0B
491
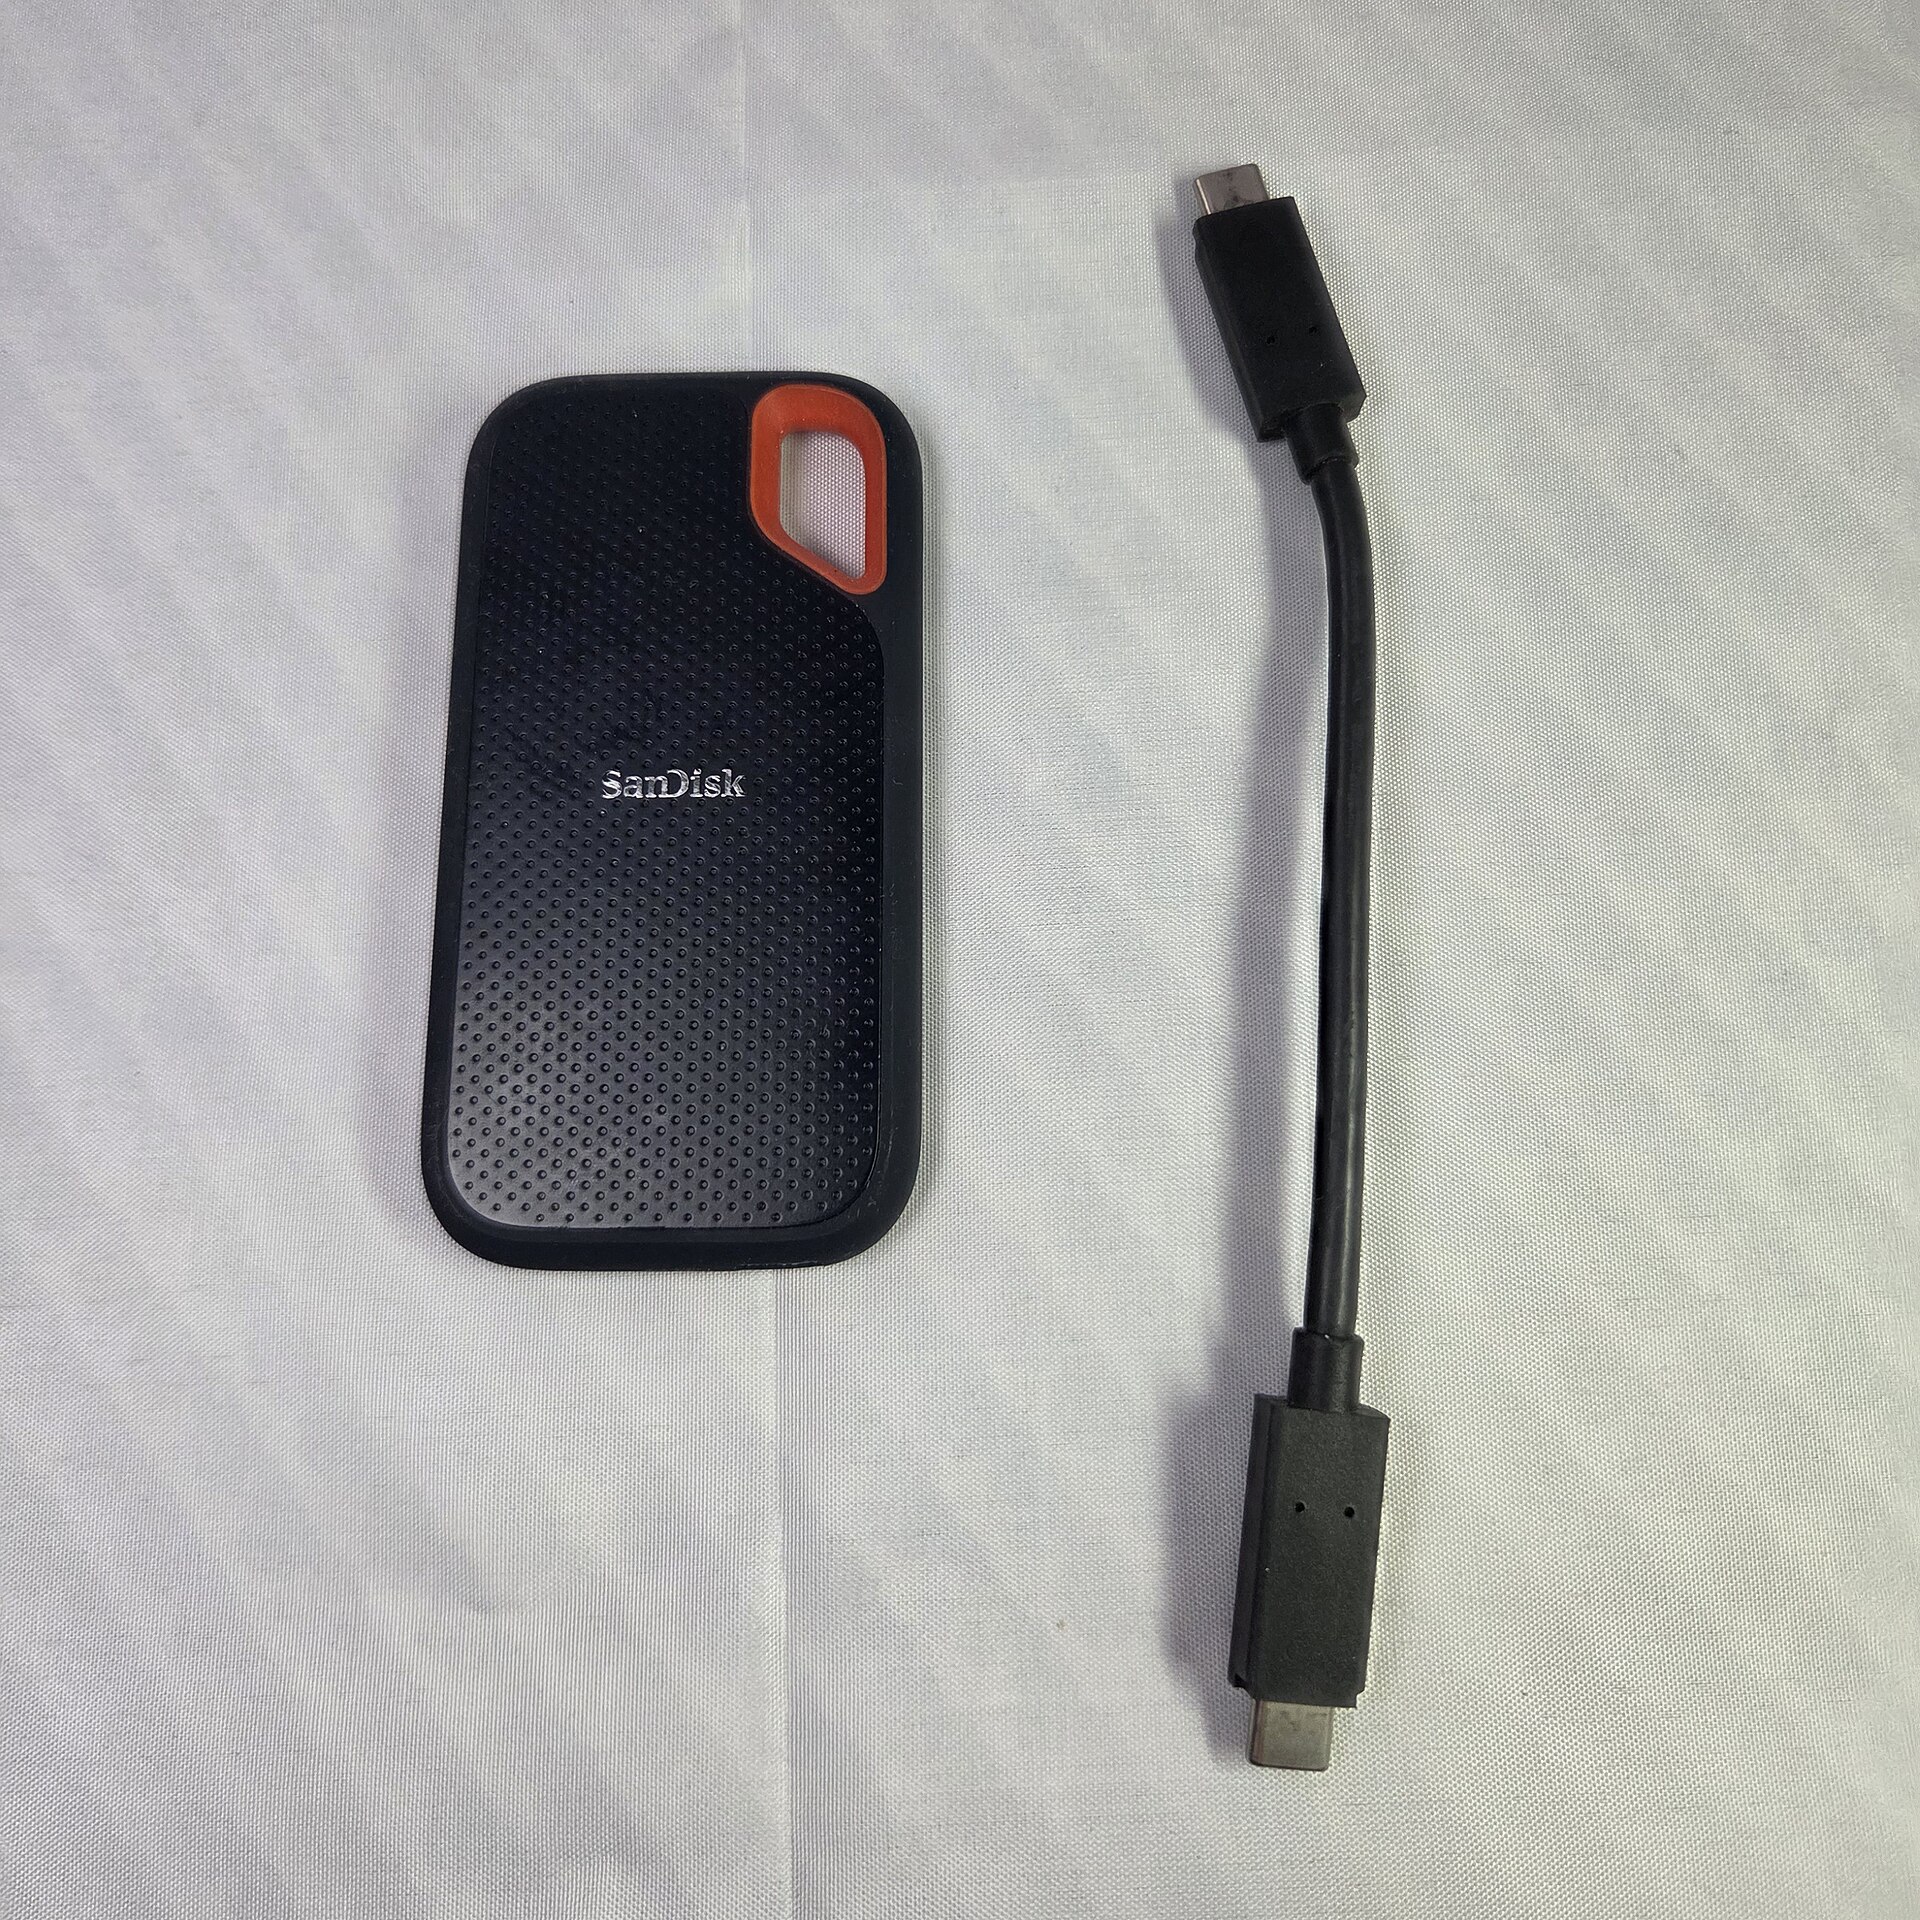
SanDisk Extreme portable solid-state drive and cable
Illustrative product photo of a SanDisk Extreme portable solid-state drive. Photo: ITEagle Europe - Sebastiaan Broekhoven / Wikimedia Commons · CC BY-SA 4.0 · Wikimedia-supplied thumbnail; displayed with a responsive crop.
THE CATALYST

Earnings and the stock move

Sandisk’s new fiscal first-quarter results exceeded dated profit and revenue expectations, while its next-quarter sales range is above the dated consensus. Data-center sales grew much faster than the rest of the business, supporting a shift toward enterprise demand. Memory pricing, customer spending and competition can still change margins, so the current profit level should not be assumed permanent.

AT A GLANCE

Q1 FY2027 ended October 2 earnings recap

Sandisk rose 1.4% after hours on October 29 after beating earnings forecasts and projecting further sales growth. Data-center demand is becoming a bigger part of its flash-memory business.

  • Adjusted earnings per share, or profit per share, were $49.51 versus the $47.2 forecast, a 4.9% beat. GAAP earnings were $52.6 per share; both figures are before the announced stock split.
  • Revenue reached $11.03 billion versus the $10.58 billion forecast, a 4.3% beat. Sales increased 23% from the previous quarter.
  • Data-center sales rose 61% from the previous quarter to $4.8 billion. Consumer sales fell 29%, showing that demand is stronger in some markets than others.
  • Sandisk issued a next-quarter sales range of $12.2–$12.6 billion, above the $12 billion forecast. It expects adjusted earnings of $55–$57 per share before the split.
  • Adjusted gross margin reached 85.1%, meaning that share of sales remained after production costs. The next-quarter range of 84.5%–85.5% points to broadly steady margins.
  • An eight-for-one stock split is expected to begin trading on November 20. It gives holders more shares at a proportionally lower price without increasing their ownership percentage or the company’s value.

Watch whether data-center demand and strong margins last through the memory cycle. The October 29 charts show the regular close before results; the next regular session will test the initial advance.

THE VISUAL RESEARCH

Financials and technicals

Charts through Oct 29, 2026. The session move above may reflect later news.

Financials
Technicals
WHAT TO WATCH

Technical setup and risks

The completed October 29 charts precede the earnings and stock-split announcements. Holding the initial advance would support buying interest; losing the regular-close level would weaken the reaction. The next regular session will help assess follow-through.

After-hours move is measured versus the same-day regular close AI-assisted research with source and calculation checks. Prices may be delayed. Technical charts use the stated completed session, which can precede the quoted intraday move. Educational information; investing involves risk.
EXPLORE COMPANY RESEARCH

Sandisk: the full stock picture

Earnings history, financials, price action and peer comparisons — all below.
Open SNDK stock page ↗

EXPLORE THE COMPANY

Sandisk (SNDK)

Explore earnings, price action, financials and industry comparisons.

Symbol
SNDK
Sector
Technology
Industry
Computer Hardware
Instrument type
EQUITY

Profile information from our saved company catalog. This is not a live quote or confirmation of current listing status.

EARNINGS & COMPANY RESEARCH

SNDK earnings, valuation & price action

View in calendar ↗
NEXT EXPECTED REPORTFeb 4 2027Time unconfirmed · ET
EPS ESTIMATE56.97
REVENUE ESTIMATE12.48B

Expected dates may change. Estimates use the source’s reporting currency. Quotes and research are snapshots, not live prices.

COMPANY RESEARCH · Technology

Sandisk Corporation SNDK

Computer Hardware · Updated 11/18/2026

Adjusted closing price · USD797.24 Nov 17
7684516132382Nov 14May 19Nov 17
Price50-day average200-day average+213.7% in view
VALUATION & EXPECTATIONS
Trailing P/E6.1×
Forward P/E3.5×
Trailing P/S4.0×
Forward P/S2.3×
EPS beat rate100%
Revenue beat rate88%
Positive window63%

EPS beats: 8 of 8 comparable reports. Positive price windows: 5 of 8.

Market caps may be up to 14 days old; prices up to seven days old; ratios and analyst estimates up to fourteen days old. Forward multiples use consensus for the fiscal year ending 2027-07-03, not the next 12 months. Negative or unavailable earnings multiples show “N/A”. Forward ADR multiples are omitted when the currency/share basis is not reconciled.

50-day average1,404.00
200-day average1,284.26
RSI (14)31
20-day range806.43 – 1,404.77
Relative volume1.2×
1-year change+213.7%
Last eight reported earnings for SNDK
Report dateEPS estimateEPS actualSurpriseResultRevenue actualPrice window*5 sessions*
Oct 29 202646.6749.51+6.1%Beat11.03B-18.1%-42.6%
Aug 5 202634.9639.25+12.3%Beat8.97B-11.8%-5.8%
Apr 30 202614.6223.41+60.1%Beat5.95B+11.5%+25.9%
Jan 29 20263.626.20+71.3%Beat3.03B+9.2%+9.2%
Nov 6 20250.881.22+38.2%Beat2.31B+10.6%+12.5%
Aug 14 20250.050.29+522.2%Beat1.9B-5.3%-3.2%
May 7 2025-0.39-0.30+23.1%Beat1.7B+8.4%+23.9%
Mar 7 20251.221.23+0.8%Beat1.88B+14.0%+17.9%

*Adjusted close before the report date to the first (or fifth) trading close after it. This window can span two sessions and is not an isolated earnings-day return. Figures may be revised by the provider.

Smart Money activity

Recent insider and politician transactions, and disclosed fund positions for SNDK.

Get Pro to see what insiders are doing ahead of earnings.

Explore insider trades, fund holdings and politician activity with an active Pro membership.

Checking membership…

SNDK earnings previews and market catalysts

Nvidia leadership uncertainty weighs on AI stocks as Lilly gains — November 12, 2026
2026-11-12 · Nvidia falls 7.64% before the open as reports of a possible leadership change unsettle AI stocks. Lilly gains after China approves its weight-loss pill; AMD also rises.

November 6 premarket: Chip stocks climb and Airbnb rises after earnings
2026-11-06 · Chip stocks led early gains, Airbnb rose after lifting its outlook, and Axon traded lower after reporting record sales. The October jobs report was next on the calendar.

Earnings ahead: watch Amazon’s operating profit and Sandisk’s pricing power
2026-10-29 · Ahead of the October 29, 2026 evening earnings reports, watch the quality of Amazon’s profit, Sandisk’s pricing strength and Starbucks’ customer recovery. Intel, healthcare and waste-service results add tests of spending and costs.

Earnings ahead: Amazon’s AI spending and Intel’s recovery face a cash-flow test
2026-10-29 · Amazon and Intel lead the earnings reports expected after close on October 29, 2026. Watch whether cloud and chip growth generate cash, while Starbucks, Mondelez and Republic Services show how demand and costs are shaping profits.

All upcoming earnings catalysts →

02 / FINANCIALS

Sandisk financials

Revenue, earnings, cash flow and financial strength in one view.

Reporting currency unconfirmed.

Revenue
Net income
Gross profit
Operating income
EBITDA
Operating cash flow
Capital expenditure
Cash
Total assets
Total liabilities
Shareholder equity
Total debt
Net profit margin
Gross margin
Short interest: days to cover
How to read these financial metrics

Figures use the app’s saved statements for the displayed period, not a trailing-year total. Margins divide profit by revenue; quick ratio uses current assets less inventory divided by current liabilities. Compare dates and currencies before comparing companies.

03 / WHAT COMES NEXT

Sandisk event catalysts

Company earnings and scheduled market events that may change expectations.

2027-02-04

SNDK earnings

Watch reported results, management’s outlook and the share-price reaction.

See earnings expectations ↑
2026-11-188:30 AM ET

Housing starts & building permits

Housing is sensitive to interest rates. Watch permits for indications of future building activity.

Release schedule ↗Scheduled
2026-11-182:00 PM ET · expected

FOMC minutes

Methodology-based date; confirm the Fed calendar closer to release.

Release schedule ↗Rule-based date
2026-11-198:30 AM ET

Initial jobless claims

Use the multiweek trend to distinguish normal volatility from a sustained increase in layoffs.

Release schedule ↗Scheduled
2026-11-2010:00 AM ET

Consumer sentiment · final

Watch changes in inflation expectations as well as sentiment.

Release schedule ↗Scheduled
2026-11-20Contract-specific cutoff

Monthly options expiration

Check your contract. Position unwinds and hedging can affect trading volume.

Release schedule ↗Scheduled
2026-11-20Time not announced

Russell · membership list update

Track revisions before the effective date; index flows do not guarantee a price rise.

Release schedule ↗Scheduled
2026-11-258:30 AM ET

Durable goods orders

Read core capital-goods orders alongside the headline; aircraft orders can create large swings.

Release schedule ↗Scheduled
2026-11-258:30 AM ET

Initial jobless claims

Use the multiweek trend; a single reading can be noisy. Thanksgiving release moves to Wednesday.

Release schedule ↗Scheduled

Dates use U.S. Eastern time and can change. Calendar events provide context; they do not determine the direction of a stock move.

04 / SIDE BY SIDE

Compare SNDK with its peers

Computer Hardware · Compare valuation, financial strength and price performance.

Companies with valuation data2
Peer median positive P/E9.3×
SNDK P/E6.1×
SNDK peer comparison: valuation
CompanyPriceMarket capP/EForward P/EP/SForward P/S
SNDKSandisk2026-11-17 · USD797.24115.13B6.1×3.5×4.0×2.3×
3986.HKGigadevice
603986.SSGigaDevice Semiconductor (Beijing) Inc.
688525.SSBiwin Storage Technology Co., Ltd.
8299.TWOPhison Electronics Corp.
9976.HKShenzhen Longsys Electronics Co., Ltd.
MUMicron Technology, Inc.2026-11-17 · USD712.42794.01B9.3×4.1×6.0×2.9×
SNDK6.1×
MU9.3×

The peer median excludes the selected stock and is based on 1 available positive multiples. P/E median excludes negative or missing earnings multiples. Peer reports can have different fiscal periods and currencies; values are not currency-converted.

05 / PEER ANALYSIS

Explore SNDK alongside its peers

Computer Hardware · 14 companies · Cached market data

Comparison

Compare companies

Tap a bubble to inspect a company, then × to hide it. Undo restores the last company hidden. Bubble area reflects market cap, with a minimum size for visibility.

Price / sales
0.0×638.56M7.4×87.32B14.8×174.01B22.1×260.69BANET · Arista Networks Market cap: 235.52B Price / sales: 19.8×DELL · Dell Technologies Market cap: 233.64B Price / sales: 1.5×HPQ · HP Market cap: 25.8B Price / sales: 0.4×SNDK · Sandisk Corporation Market cap: 115.13B Price / sales: 4.0×Hide SNDK · Undo restores itMarket cap
SNDKSandisk Corporation

Market cap: 115.13B
Price / sales: 4.0×

Valuation snapshot: 2026-11-17
4 of 14 companies have both plotted values.

P/S distribution

Trailing price-to-sales multiples · 4 companies

Median P/S2.8×
Middle 50%1.3× to 7.9×
SNDK P/S4.0×
SNDK
0.4×20.8×

Tap a bar to see the companies in that P/S range. SNDK has a higher P/S than 50% of this group.

10 companies excluded from P/S statistics because sales are non-positive or the saved multiple is missing. Statistics include all valid positive values, including those outside the focused chart range.

Companies

Showing 8 of 14 matching companies · Largest market cap first

  • Market cap 235.52BP/E 49.4×P/S 19.8×Forward P/E Forward P/S Price snapshot: 2026-11-17
    ↗
  • Market cap 233.64BP/E 21.0×P/S 1.5×Forward P/E Forward P/S Price snapshot: 2026-11-17
    ↗
  • Market cap 188.03BP/E P/S Forward P/E Forward P/S Catalog snapshot
    ↗
  • Market cap 181.72BP/E P/S Forward P/E Forward P/S Catalog snapshot
    ↗
  • Market cap 115.13BP/E 6.1×P/S 4.0×Forward P/E Forward P/S Price snapshot: 2026-11-17
    ↗
  • Market cap 25.8BP/E 10.8×P/S 0.4×Forward P/E Forward P/S Price snapshot: 2026-11-17
    ↗
  • Market cap 18.53BP/E P/S Forward P/E Forward P/S Catalog snapshot
    ↗
  • Market cap 15.05BP/E P/S Forward P/E Forward P/S Catalog snapshot
    ↗

Explore industries

Open an industry for its comparison, valuation and companies.

U.S.-listed companies from the app’s catalog. Medians use saved positive P/E values; coverage and snapshot dates vary.

How this comparison works

Uses the saved companies from the same industry and listing market, including SNDK, ordered by cached market cap. Company snapshots can have different dates; the web cache may cover fewer metrics and periods than the app.

Periods end at each company’s dated price snapshot. Change compares the latest saved observation with one at or before the selected period’s start. A daily price change uses consecutive saved sessions. Financial data updates quarterly, so short periods may show no change. Missing history and zero starting values are excluded; a negative starting value uses its absolute value as the denominator.

Metrics use saved ratios and percentages. Market caps use the listing market’s reporting currency; underlying financial statements may use different currencies. Circle sizes have a minimum for touch visibility, and an outlined circle indicates a missing market cap. These comparisons describe data, not recommendations or price predictions.

INDUSTRY COMPARISON

SNDK industry peers

Computer Hardware · Oct 16, 2026 · Closing-price performance

Compare SNDK with 4 other stocks in the available heatmap coverage.