
Share Oracle falls as $20 billion stock and debt offering plans put funding costs in focus
← Stock movers news
Market movers
Oracle CorporationORCL · Software - Infrastructure
ORCL · November 2, 2026During trading · Since the previous regular close
-4.59%Session snapshot

Oracle falls as $20 billion stock and debt offering plans put funding costs in focus
10
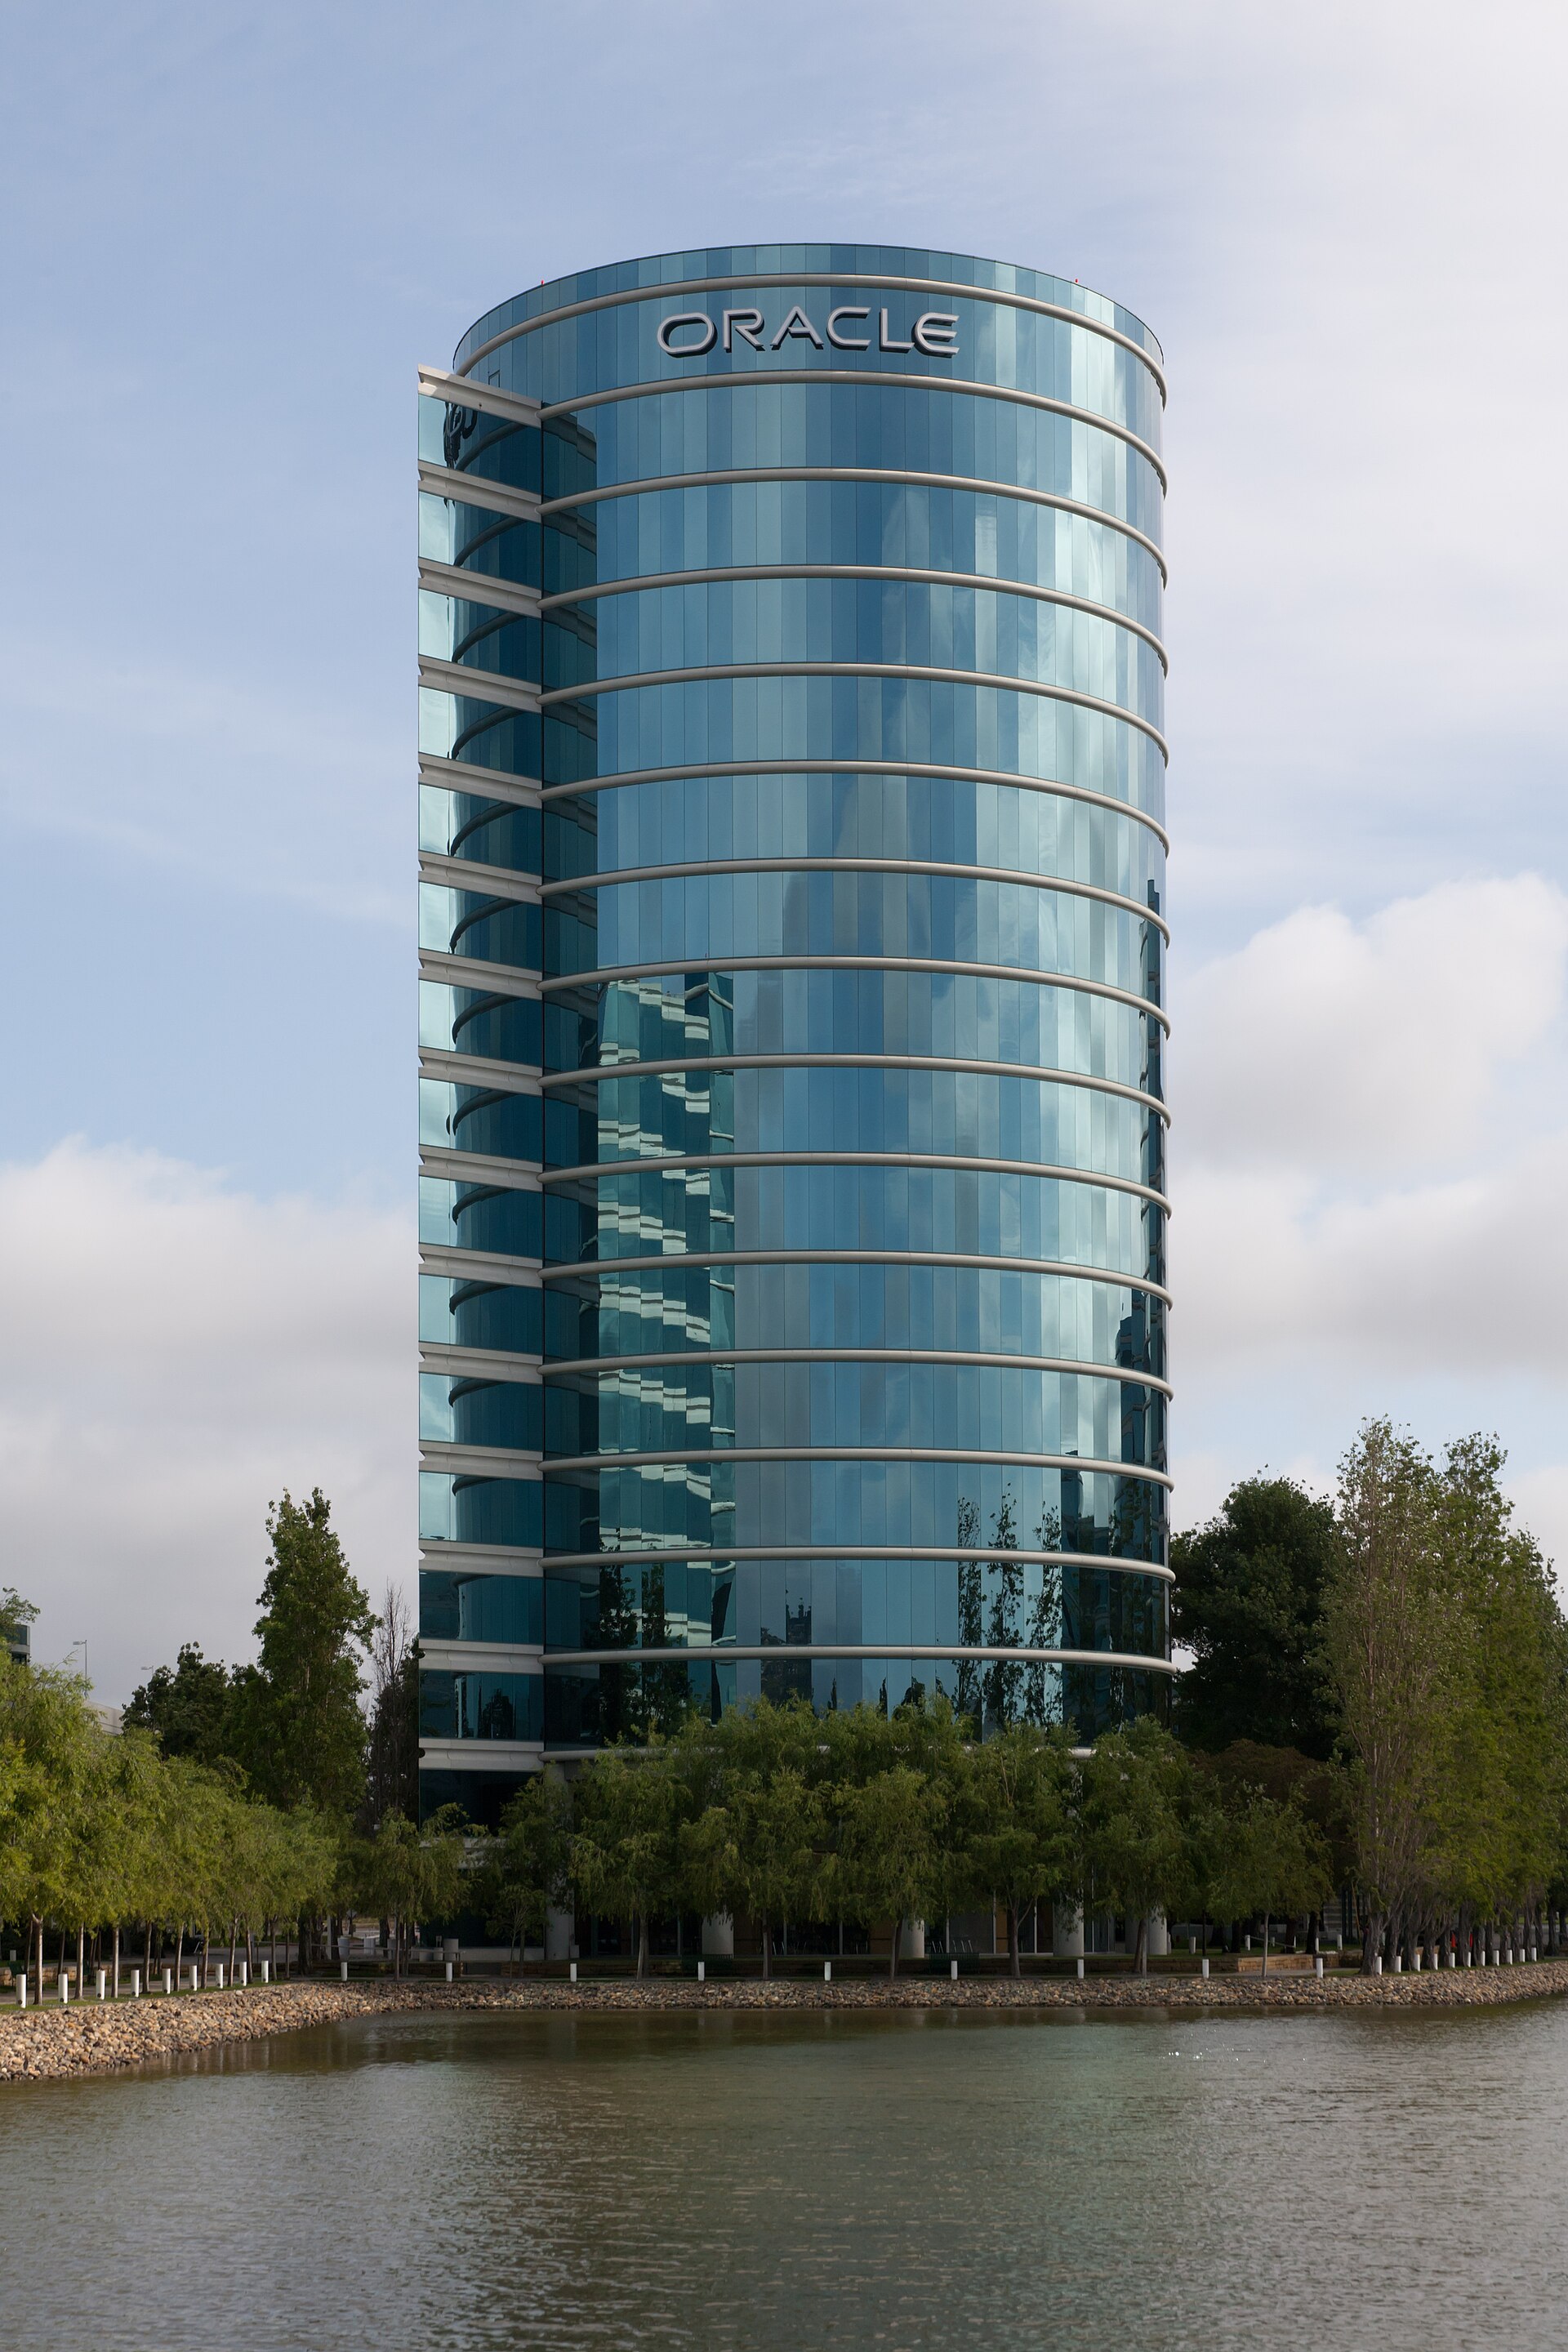
Oracle office building beside the water at its Redwood Shores campus.
Archive: Oracle building 300 at its former headquarters campus in Redwood Shores, California, photographed May 7, 2011. This is not the October 2026 Investor Day venue. Photo: King of Hearts / Wikimedia Commons · CC BY-SA 3.0 · Wikimedia-supplied thumbnail; displayed with a responsive crop.
THE CATALYST

What is behind the stock move?

Oracle filed preliminary prospectus supplements on November 2 for a $10 billion common-stock offering and a separate $10 billion senior-notes offering. The preliminary filings were available before the regular-session price used here. The stock document illustrates 76.5M new shares at the October 30 reference price of $130.67, taking the August 31 common-share count of 3.02B to 3.1B. That is approximately 2.53% more common shares, with the actual issuance dependent on the sale price. The new funding offers financial capacity for capital spending, debt repayment and other general corporate uses, while introducing ownership dilution and borrowing costs. The August-quarter filing reported $28.5 billion of capital expenditures, giving concrete context for the investment requirements. The two offerings are independent, preliminary and unpriced in the reviewed documents; no completed financing, final coupon or exclusive use for a particular AI project is asserted. The stock declined during trading after the filings; the funding tradeoff is the investor issue to assess, rather than an invented earnings disappointment. The offerings implement financing previously discussed at the October 28 investor day, when management described an additional $20 billion split evenly between debt and equity; this is not evidence of a newly enlarged funding target.

AT A GLANCE

Latest company research

Oracle filed plans for $10 billion of new stock and a separate $10 billion debt offering on November 2. Shares traded at $124.67, down 4.59% during trading, with funding costs and shareholder ownership in focus.

  • The stock filing illustrates about 76.5 million new shares if sold at the October 30 closing price of $130.67. That would increase the earlier common-share count by roughly 2.5%; the actual share count depends on the sale price.
  • The separate debt offering would raise another $10 billion. Borrowing avoids issuing additional common shares, but brings interest costs and repayment obligations.
  • Oracle sells databases, business applications and cloud computing capacity. Its August-quarter filing showed $28.5 billion of capital spending, illustrating the scale of the investment needed to expand its infrastructure.
  • The filings put a financing plan discussed at last week’s investor day into motion. Proceeds may go to capital spending, debt repayment or other corporate uses; they are not all earmarked for one AI project.
  • Both documents are preliminary, with the final stock price and bond rates still blank in the reviewed filings. The offerings can close independently; neither confirms that the full $20 billion has already been received.
  • The completed October 30 chart closed at $130.67, below its 20-day and 50-day averages. The $123–124.50 October low area is nearby; reclaiming $134–137 would improve the recovery attempt.

Watch the final share price, bond rates and whether new capacity converts into cash from customers. A larger share count can reduce each investor’s ownership percentage, while heavier interest costs can absorb future profit.

THE VISUAL RESEARCH

Financials and technicals

Charts through Oct 30, 2026. The session move above may reflect later news.

Financials
Technicals
WHAT TO WATCH

Technical setup and risks

October 30 close $130.67, SMA20 $134.73, SMA50 $141.8, Wilder RSI14 45.62, ATR14 $7.64. October22low122.76, October23low124.39 and October26low123.75 ground the low area about123–124.5. The134–137reaction zone draws on October8low134.66, October12low136.52 and October30high135.20. These are approximate observations, not price promises. November2regular-session quote is distinct from October30completed candles; recovery over134–137 and closing behavior near123–124.5 require confirmation.

AI-assisted research with source and calculation checks. Prices may be delayed. Technical charts use the stated completed session, which can precede the quoted intraday move. Educational information; investing involves risk.
EXPLORE COMPANY RESEARCH

Oracle: the full stock picture

Earnings history, financials, price action and peer comparisons — all below.
Open ORCL stock page ↗

EXPLORE THE COMPANY

Oracle (ORCL)

Explore earnings, price action, financials and industry comparisons.

Symbol
ORCL
Sector
Technology
Industry
Software - Infrastructure
Instrument type
EQUITY

Profile information from our saved company catalog. This is not a live quote or confirmation of current listing status.

EARNINGS & COMPANY RESEARCH

ORCL earnings, valuation & price action

View in calendar ↗
NEXT EXPECTED REPORTDec 14 2026Time unconfirmed · ET
EPS ESTIMATE1.88
REVENUE ESTIMATE21.33B

Expected dates may change. Estimates use the source’s reporting currency. Quotes and research are snapshots, not live prices.

COMPANY RESEARCH · Technology

Oracle Corporation ORCL

Software - Infrastructure · Updated 11/1/2026

Adjusted closing price · USD130.67 Oct 30
112169225281Oct 29May 1Oct 30
Price50-day average200-day average-51.9% in view
VALUATION & EXPECTATIONS
Trailing P/E22.3×
Forward P/E16.1×
Trailing P/S6.1×
Forward P/S4.8×
EPS beat rate63%
Revenue beat rate50%
Positive window38%

EPS beats: 5 of 8 comparable reports. Positive price windows: 3 of 8.

Market caps may be up to 14 days old; prices up to seven days old; ratios and analyst estimates up to fourteen days old. Forward multiples use consensus for the fiscal year ending 2027-05-31, not the next 12 months. Negative or unavailable earnings multiples show “N/A”. Forward ADR multiples are omitted when the currency/share basis is not reconciled.

50-day average141.43
200-day average155.92
RSI (14)46
20-day range125.54 – 144.54
Relative volume1.3×
1-year change-51.9%
Last eight reported earnings for ORCL
Report dateEPS estimateEPS actualSurpriseResultRevenue actualPrice window*5 sessions*
Sep 10 20261.741.92+10.3%Beat19.35B-7.0%-6.8%
Jun 10 20261.962.11+7.7%Beat19.18B-10.5%-10.8%
Mar 10 20261.701.79+5.3%Beat17.19B+7.6%+2.1%
Dec 10 20251.642.26+37.8%Beat16.06B-10.2%-19.4%
Sep 9 20251.481.47-0.7%Miss14.93B+37.7%+28.6%
Jun 11 20251.641.70+3.7%Beat15.9B+12.6%+18.8%
Mar 10 20251.491.47-1.3%Miss14.13B-7.1%-0.7%
Dec 9 20241.481.47-0.7%Miss14.06B-7.3%-10.7%

*Adjusted close before the report date to the first (or fifth) trading close after it. This window can span two sessions and is not an isolated earnings-day return. Figures may be revised by the provider.

02 / FINANCIALS

Oracle financials

Revenue, earnings, cash flow and financial strength in one view.

Reporting currency unconfirmed.

Revenue
Net income
Gross profit
Operating income
EBITDA
Operating cash flow
Capital expenditure
Cash
Total assets
Total liabilities
Shareholder equity
Total debt
Net profit margin
Gross margin
Short interest: days to cover
How to read these financial metrics

Figures use the app’s saved statements for the displayed period, not a trailing-year total. Margins divide profit by revenue; quick ratio uses current assets less inventory divided by current liabilities. Compare dates and currencies before comparing companies.

03 / WHAT COMES NEXT

Oracle event catalysts

Company earnings and scheduled market events that may change expectations.

2026-12-14

ORCL earnings

Watch reported results, management’s outlook and the share-price reaction.

See earnings expectations ↑
2026-11-0210:00 AM ET

ISM manufacturing PMI

Watch new orders and prices paid for the balance between demand and inflation.

Release schedule ↗Scheduled
2026-11-0310:00 AM ET

JOLTS job openings

Watch vacancies and quits for signs of labor-market cooling.

Release schedule ↗Scheduled
2026-11-0410:00 AM ET

ISM services PMI

Services prices and employment can influence the outlook for inflation and rates.

Release schedule ↗Scheduled
2026-11-058:30 AM ET

Initial jobless claims

Use the multiweek trend to distinguish normal volatility from a sustained increase in layoffs.

Release schedule ↗Scheduled
2026-11-068:30 AM ET

Jobs report · payrolls & unemployment

Read revisions and wages alongside the headline. Strong hiring can support demand but also lift rate expectations.

Release schedule ↗Scheduled
2026-11-0610:00 AM ET

Consumer sentiment · preliminary

Watch changes in inflation expectations as well as sentiment.

Release schedule ↗Scheduled
2026-11-108:30 AM ET

CPI inflation

Compare headline and core inflation with expectations; watch Treasury yields and growth stocks.

Release schedule ↗Scheduled
2026-11-11Time not announced

MSCI · index review announcement

Review official additions, deletions and weight changes; release time is not specified here.

Release schedule ↗Scheduled

Dates use U.S. Eastern time and can change. Calendar events provide context; they do not determine the direction of a stock move.

04 / SIDE BY SIDE

Compare ORCL with its peers

Software - Infrastructure · Compare valuation, financial strength and price performance.

Companies with valuation data6
Peer median positive P/E29.4×
ORCL P/E22.3×
ORCL peer comparison: valuation
CompanyPriceMarket capP/EForward P/EP/SForward P/S
ORCLOracle2026-10-30 · USD130.67436.45B22.3×16.1×6.1×4.8×
CRMSalesforce, Inc.2026-10-30 · USD229.17199.52B22.0×13.7×4.5×4.3×
IBMInternational Business Machines Corporation2026-10-30 · USD257.81243.66B21.7×20.8×3.5×3.5×
MSFTMicrosoft Corporation2026-10-30 · USD521.913.95T29.6×26.4×11.9×10.1×
NOWServiceNow, Inc.2026-10-30 · USD103.62113.38B78.3×26.1×7.3×7.0×
SAPSAP SE2026-10-30 · USD235.02263.38B29.4×6.1×
ORCL22.3×
CRM22.0×
IBM21.7×
MSFT29.6×
NOW78.3×
SAP29.4×

The peer median excludes the selected stock and is based on 5 available positive multiples. P/E median excludes negative or missing earnings multiples. Peer reports can have different fiscal periods and currencies; values are not currency-converted.

05 / PEER ANALYSIS

Explore ORCL alongside its peers

Software - Infrastructure · 42 companies · Cached market data

Comparison

Compare companies

Tap a bubble to inspect a company, then × to hide it. Undo restores the last company hidden. Bubble area reflects market cap, with a minimum size for visibility.

Price / sales
0.0×027.1×1.48T54.1×2.95T81.2×4.43TMSFT · Microsoft Market cap: 3.95T Price / sales: 11.9×PLTR · Palantir Technologies Market cap: 446.08B Price / sales: 72.5×PANW · Palo Alto Networks Market cap: 306.26B Price / sales: 26.7×CRWD · CrowdStrikes Market cap: 273.04B Price / sales: 50.6×FTNT · Fortinet Market cap: 125.41B Price / sales: 16.7×NET · Cloudflare Market cap: 109.49B Price / sales: 43.6×SNPS · Synopsys Market cap: 85.78B Price / sales: 9.1×NTAP · NetApp Market cap: 41.24B Price / sales: 5.6×TWLO · Twilio Market cap: 39.73B Price / sales: 7.1×ZS · Zscaler Market cap: 34.98B Price / sales: 10.4×CRWV · CoreWeave Market cap: 33.52B Price / sales: 4.4×OKTA · Okta Market cap: 32.43B Price / sales: 10.6×MDB · MongoDB Market cap: 29.45B Price / sales: 10.6×VRSN · VeriSign Market cap: 27.71B Price / sales: 16.2×FFIV · F5 Market cap: 25.86B Price / sales: 7.8×RBRK · Rubrik Market cap: 23.77B Price / sales: 15.4×NTNX · Nutanix Market cap: 18.45B Price / sales: 6.5×CHKP · Check Point Software Technologi Market cap: 14.53B Price / sales: 5.3×AKAM · Akamai Technologies Market cap: 12.88B Price / sales: 3.0×DOCN · DigitalOceans Market cap: 11.92B Price / sales: 11.8×IREN · IREN LIMITED Market cap: 11.47B Price / sales: 16.2×ZETA · Zeta Globals Corp. Market cap: 7.95B Price / sales: 5.1×DBX · Dropbox Market cap: 7.91B Price / sales: 3.1×PATH · UiPath Market cap: 7B Price / sales: 4.1×DOX · Amdocs Market cap: 6.61B Price / sales: 1.4×QLYS · Qualys Market cap: 6.59B Price / sales: 9.4×ACIW · ACI Worldwide Market cap: 5.51B Price / sales: 3.0×VRNS · Varonis Systems Market cap: 5.33B Price / sales: 7.7×TENB · Tenables Market cap: 4.5B Price / sales: 4.3×BLSH · Bullish Market cap: 4.42B Price / sales: 0.0×WIX · Wix Market cap: 3.31B Price / sales: 1.6×TDC · Teradata Market cap: 3.19B Price / sales: 1.9×APPN · Appian Market cap: 3.19B Price / sales: 4.0×STNE · StoneCo Market cap: 2.78B Price / sales: 1.0×FIVN · Five9 Market cap: 2.56B Price / sales: 2.1×EEFT · Euronet Worldwide Market cap: 2.47B Price / sales: 0.6×GCT · GigaCloud Technology Market cap: 2.1B Price / sales: 1.4×AI · C3.ai Market cap: 1.82B Price / sales: 7.8×RPD · Rapid7 Market cap: 891.04M Price / sales: 1.0×RXT · Rackspace Technology Market cap: 690.71M Price / sales: 0.3×SABR · Sabre Market cap: 633.63M Price / sales: 0.2×ORCL · Oracle Corporation Market cap: 436.45B Price / sales: 6.1×Hide ORCL · Undo restores itMarket cap
ORCLOracle Corporation

Market cap: 436.45B
Price / sales: 6.1×

Valuation snapshot: 2026-10-30
42 of 42 companies have both plotted values.

P/S distribution

Trailing price-to-sales multiples · 42 companies

Median P/S5.8×
Middle 50%2.3× to 10.6×
ORCL P/S6.1×
ORCL
0.0×17.5×

Tap a bar to see the companies in that P/S range. ORCL has a higher P/S than 50% of this group.

0 companies excluded from P/S statistics because sales are non-positive or the saved multiple is missing. Statistics include all valid positive values, including those outside the focused chart range.

Companies

Showing 8 of 42 matching companies · Largest market cap first

  • Market cap 3.95TP/E 29.6×P/S 11.9×Forward P/E Forward P/S Price snapshot: 2026-10-30 · Financials: 2026-09-30
    ↗
  • Market cap 446.08BP/E 153.9×P/S 72.5×Forward P/E Forward P/S Price snapshot: 2026-10-30
    ↗
  • Market cap 436.45BP/E 22.3×P/S 6.1×Forward P/E Forward P/S Price snapshot: 2026-10-30
    ↗
  • Market cap 306.26BP/E 813.9×P/S 26.7×Forward P/E Forward P/S Price snapshot: 2026-10-30
    ↗
  • Market cap 273.04BP/E 7575.6×P/S 50.6×Forward P/E Forward P/S Price snapshot: 2026-10-30
    ↗
  • Market cap 125.41BP/E 59.8×P/S 16.7×Forward P/E Forward P/S Price snapshot: 2026-10-30
    ↗
  • Market cap 109.49BP/E P/S 43.6×Forward P/E Forward P/S Price snapshot: 2026-10-30
    ↗
  • Market cap 85.78BP/E 77.7×P/S 9.1×Forward P/E Forward P/S Catalog snapshot
    ↗

Explore industries

Open an industry for its comparison, valuation and companies.

U.S.-listed companies from the app’s catalog. Medians use saved positive P/E values; coverage and snapshot dates vary.

How this comparison works

Uses the saved companies from the same industry and listing market, including ORCL, ordered by cached market cap. Company snapshots can have different dates; the web cache may cover fewer metrics and periods than the app.

Periods end at each company’s dated price snapshot. Change compares the latest saved observation with one at or before the selected period’s start. A daily price change uses consecutive saved sessions. Financial data updates quarterly, so short periods may show no change. Missing history and zero starting values are excluded; a negative starting value uses its absolute value as the denominator.

Metrics use saved ratios and percentages. Market caps use the listing market’s reporting currency; underlying financial statements may use different currencies. Circle sizes have a minimum for touch visibility, and an outlined circle indicates a missing market cap. These comparisons describe data, not recommendations or price predictions.

INDUSTRY COMPARISON

ORCL industry peers

Software - Infrastructure · Oct 16, 2026 · Closing-price performance

Compare ORCL with 4 other stocks in the available heatmap coverage.