Oracle surges as Investor Day sets a path to positive cash flow

What is behind the stock move?
Oracle’s October 28 Investor Day set out a timetable for positive free cash flow and limited additional capital-market funding for its cloud investment cycle. Shares rallied as investors assessed the updated plan. Our analysis: the cash-flow and financing commitments matter because fast cloud growth requires heavy upfront investment. Revenue and profit targets remain forecasts, and planned financing is not money already raised.
Latest company research
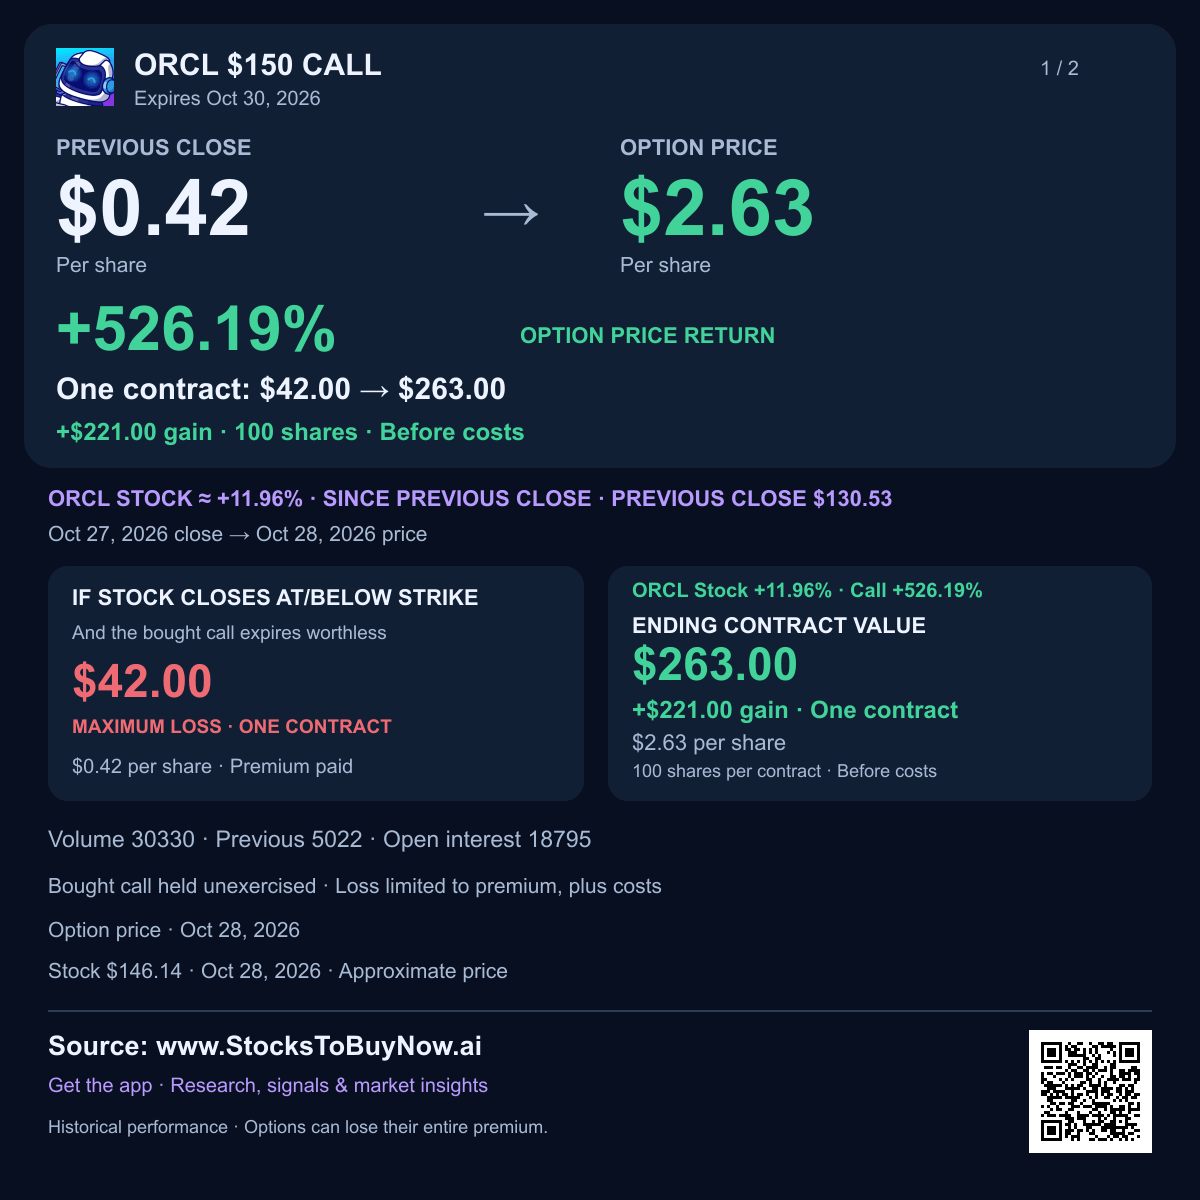
Oracle rose about 11% to $144.87 on October 28, 2026 as its Investor Day outlined a path to positive cash flow. The plan addresses how Oracle will fund its cloud expansion.
- Oracle targets at least $225 billion in fiscal 2030 revenue and more than $21 in adjusted EPS, or profit per share. Those are management goals, not completed sales or earnings.
- The company expects free cash flow, cash left after capital spending, to turn positive in the second half of fiscal 2028. It targets at least $30 billion in fiscal 2029.
- Oracle plans another $20 billion of capital-market funding through fiscal 2030, excluding debt refinancing. That comes on top of the $20 billion stock sale already completed in fiscal 2027.
- The fiscal 2027 outlook was reaffirmed at at least $90 billion in revenue and $8.1 in adjusted profit per share. The investor update adds a longer-term funding roadmap.
- Cloud expansion is already driving growth: September’s fiscal first-quarter report showed cloud revenue up 62%. But fiscal 2026 free cash flow was negative $23.7 billion, showing the cost of building capacity.
- Customer prepayments, customer-supplied hardware and vendor financing could reduce upfront cash needs. The risk is that capacity delays, financing costs or weaker customer demand postpone the expected payoff.
The rally is challenging the $142–$145 area seen in earlier October trading. Holding above it would strengthen the rebound; slipping below $134.5–$136.5 would weaken it. Watch cash generation alongside revenue growth.
Financials and technicals
Charts through Oct 27, 2026. The session move above may reflect later news.
Technical setup and risks
The rally challenges $142–$145 an earlier October trading and moving-average area. Sustained closes above that zone would support follow-through; losing $134.5–$136.5 would weaken the rebound. Cloud execution, financing costs, customer concentration and dilution are risks.
AI-assisted research with source and calculation checks. Prices may be delayed. Technical charts use the stated completed session, which can precede the quoted intraday move. Educational information; investing involves risk.