Newmont falls as weaker gold puts future mining profits in focus

What is behind the stock move?
Gold fell about 2.1% to $3,769.68 an ounce before the U.S. open on November 18 as the dollar stayed strong and expectations of higher interest rates weighed on demand. Newmont’s shares fell during trading, consistent with the pressure on a producer whose sales are dominated by gold. Lower bullion prices reduce revenue per ounce, while many mining costs persist. The company’s October production and cost outlook provides context for how much operating improvement could offset a weaker gold market.
Latest company research
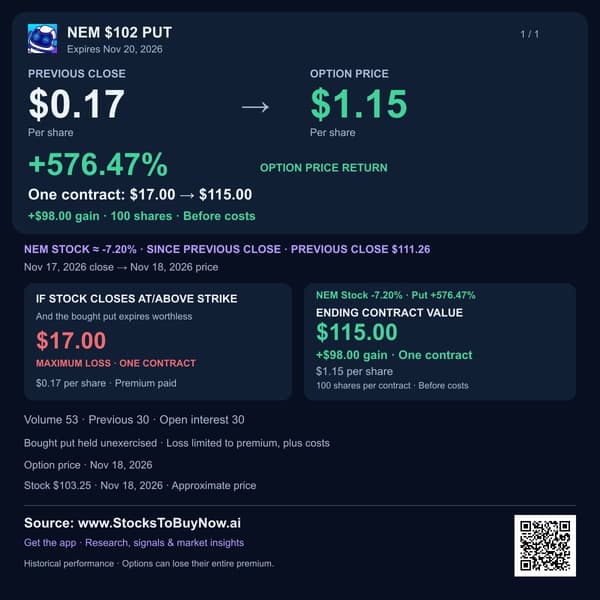
Newmont fell 5.3% to $105.33 during trading on November 18, 2026 as gold slid to its lowest level in more than a year. Lower bullion prices put future mining profits under pressure.
- Gold dropped about 2.1% before the U.S. open. A strong dollar and expectations of higher interest rates weighed on demand for the metal.
- Gold pays no interest, so higher returns on cash and bonds can make it less attractive. For Newmont, a weaker gold price also means less revenue for each ounce sold.
- Gold generated about 85% of Newmont’s sales in 2025. That concentration explains why shifts in bullion prices matter so much to its outlook.
- In its October 22 update, Newmont kept its annual gold-production target at 5.3 million ounces. It lowered its sustaining-cost outlook—costs including mine upkeep—to $1,520 an ounce.
- The next production test is the fourth quarter, which management expected to be its strongest of the year. Water shortages at Lihir and higher spending could still pressure output and costs.
- The November 17 chart showed price below its main moving averages. November 18 trading has since fallen beneath the $110–112.50 support area shown on that chart.
Watch gold’s response to the next Federal Reserve signals alongside Newmont’s production and costs. A cheaper share price alone does not establish that the decline is over.
Financials and technicals
Charts through Nov 17, 2026. The session move above may reflect later news.
Technical setup and risks
The November 17 closing chart showed support around $110–112.50 and resistance around $114–116.50. November 18 trading at $105.33 has broken below that former support. A sustained recovery above it would help repair the trend, while continued weakness in gold or rising mining costs could prolong the decline. These are conditional scenarios, not guaranteed targets.
AI-assisted research with source and calculation checks. Prices may be delayed. Technical charts use the stated completed session, which can precede the quoted intraday move. Educational information; investing involves risk.