Nebius falls as AI-cloud funding concerns deepen
What is behind the stock move?
Nebius fell alongside AI-cloud shares as reporting on November 20 highlighted financing and capacity constraints. The business needs substantial investment before new facilities generate revenue. Its November 12 outlook provides context: capacity delays pushed 2026 revenue toward the low end of guidance, while management expects customer prepayments and contract-backed financing to fund most planned 2027 investment. These are management expectations, not guaranteed funding outcomes.
Latest company research
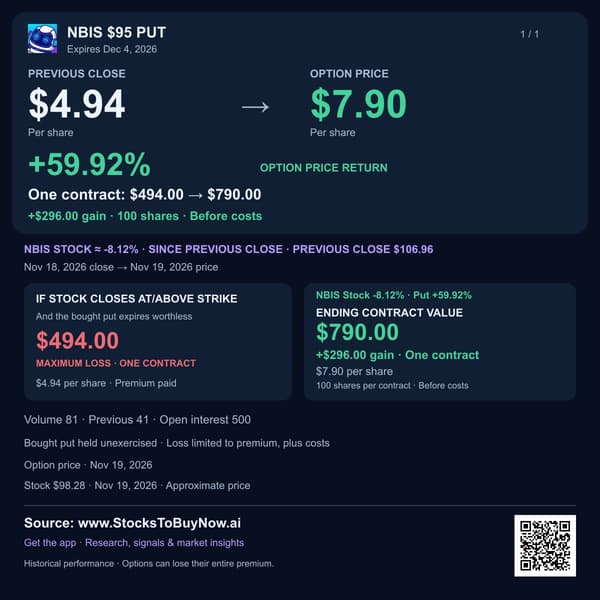
Nebius fell 13.65% during trading on November 20 as AI-cloud shares faced renewed concerns about financing their expansion.
- Current reporting points to a retreat from AI stocks and doubts about the capital needed for new computing capacity. Strong demand alone does not pay for data centers.
- Nebius rents computing power and software to AI developers. Its growth depends on bringing equipment, power and buildings into service on time.
- In its November 12 update, the company put 2026 revenue at the low end of its $3–3.4 billion range after capacity delays. Those are earlier results, not a new earnings release.
- Management expects $40–45 billion of capital spending in 2027. It expects customer prepayments and financing against existing contracts to cover 75–85% of that amount; this remains a forecast.
- The investment question is whether new capacity turns into revenue quickly enough to support the funding needed. Delays, borrowing costs and additional share issuance could pressure investors.
- Nebius closed November 19 at $96.92, below both its 20-day and 50-day averages. The November 20 decline has moved below the historical support zone shown in the chart.
Watch construction progress, customer payments and funding terms. The charts end at the November 19 close; November 20 trading is separate.
Financials and technicals
Charts through Nov 19, 2026. The session move above may reflect later news.
Technical setup and risks
The completed November 19 chart shows support near $96–98 and resistance near $106–110. November 20 trading has broken below that historical support. Reclaiming $110 would improve the setup; continued weakness below $96 would extend the breakdown.
AI-assisted research with source and calculation checks. Prices may be delayed. Technical charts use the stated completed session, which can precede the quoted intraday move. Educational information; investing involves risk.