
Share Nebius rises before open as Nvidia earnings lift AI infrastructure stocks
← Stock movers news
Market movers
Nebius Group N.V.NBIS · Internet Content & Information
NBIS · November 18, 2026Before open · Since the previous regular close
+7.87%Session snapshot

Nebius rises before open as Nvidia earnings lift AI infrastructure stocks
400
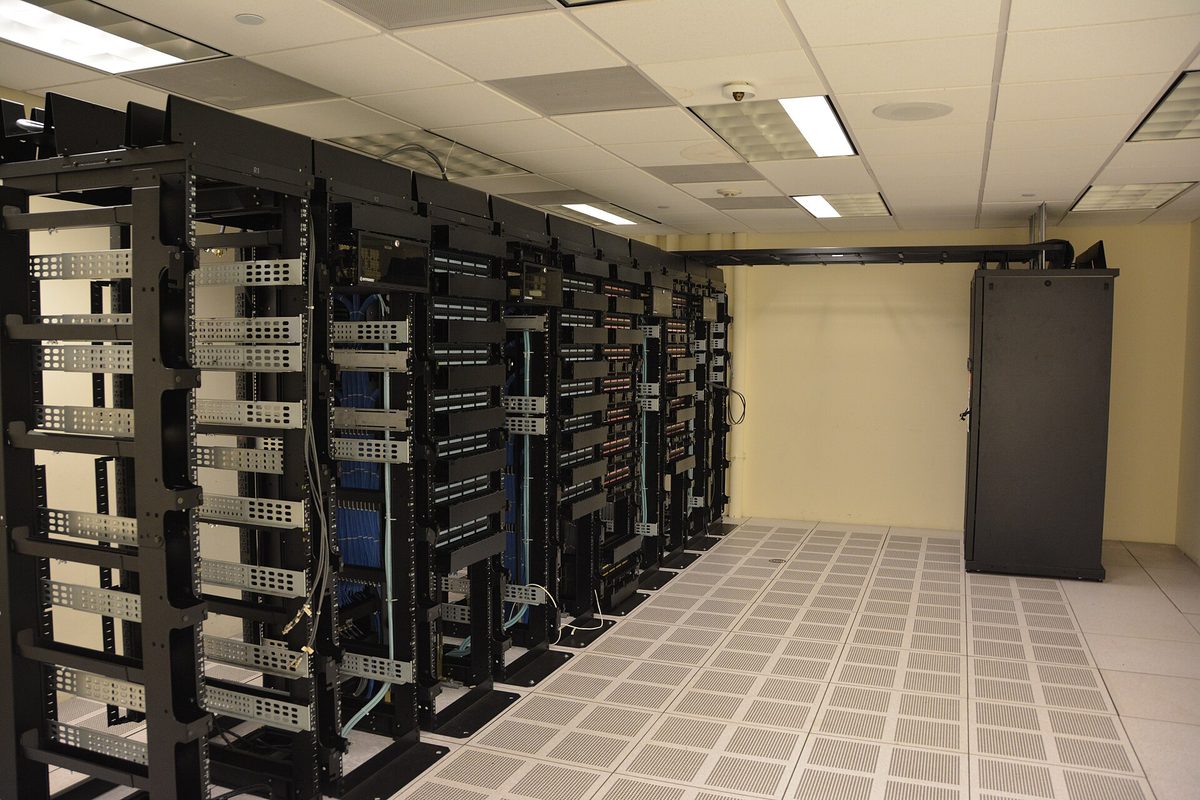
Rows of server racks inside a data center, shown as an illustration of computing infrastructure.
Illustrative archive photograph of data-center server racks, November 4, 2015. This is not a Nebius facility. Photo: Carl Lender from Sunrise, USA / Wikimedia Commons · CC BY 2.0 · Resized to at most 1200px wide and JPEG compressed; a smaller feed preview is available.
THE CATALYST

What is behind the stock move?

Nvidia’s November 17 earnings and outlook renewed interest in AI infrastructure stocks, with reporting linking Nebius’s overnight advance to that release. Nvidia also identified Nebius as a partner running Vera Rubin systems. Strong demand at the chip supplier supports the sector outlook, while Nebius still needs to finance and fill its expanding computing capacity.

AT A GLANCE

Latest company research

Nebius rose 7.87% before open on November 18, 2026, extending the AI infrastructure rebound following Nvidia’s earnings.

  • Nvidia reported $115.8 billion in quarterly revenue and forecast $130 billion for the next quarter. That supports confidence in demand for AI computing.
  • Nvidia also named Nebius among partners already running its Vera Rubin systems. New hardware can help Nebius attract customers seeking faster computing.
  • Nebius rents computing capacity to AI developers. Its own November 12 results showed quarterly revenue of $980.8 million, separate from Nvidia’s newer announcement.
  • Growth remains expensive: Nebius spent $7.3 billion on equipment and intangible assets in that quarter, while operating activities used $273 million in cash.
  • The November 17 closing price was $106.04, below the 20-day and 50-day averages. The pre-market rebound has not yet established a sustained recovery.
  • Watch whether the stock holds above the recent $111–112 rebound highs during regular trading. A fall below the $102–105 recent low area would weaken the setup.

The next test is turning added computing capacity into lasting revenue and cash flow. Financing needs and rapid hardware replacement remain important risks.

THE VISUAL RESEARCH

Financials and technicals

Charts through Nov 17, 2026. The session move above may reflect later news.

Financials
Technicals
WHAT TO WATCH

Technical setup and risks

November 17 completed chart: recent lows around $102–105 and November 16–17 highs around $111–112. Sustained regular-session closes above $112 would strengthen a recovery; a break below $102 would weaken it. These are approximate areas, not guaranteed turning points.

AI-assisted research with source and calculation checks. Prices may be delayed. Technical charts use the stated completed session, which can precede the quoted intraday move. Educational information; investing involves risk.
EXPLORE COMPANY RESEARCH

Nebius N.V.: the full stock picture

Earnings history, financials, price action and peer comparisons — all below.
Open NBIS stock page ↗

EXPLORE THE COMPANY

Nebius N.V. (NBIS)

Explore earnings, price action, financials and industry comparisons.

Symbol
NBIS
Sector
Communication Services
Industry
Internet Content & Information
Instrument type
EQUITY

Profile information from our saved company catalog. This is not a live quote or confirmation of current listing status.

EARNINGS & COMPANY RESEARCH

NBIS earnings, valuation & price action

View in calendar ↗
NEXT EXPECTED REPORTFeb 11 2027Time unconfirmed · ET
EPS ESTIMATE-0.85
REVENUE ESTIMATE1.25B

Expected dates may change. Estimates use the source’s reporting currency. Quotes and research are snapshots, not live prices.

COMPANY RESEARCH · Technology

Nebius Group N.V. NBIS

Software - Application · Updated 11/17/2026

Adjusted closing price · USD106.04 Nov 17
58136214292Nov 14May 19Nov 17
Price50-day average200-day average+26.9% in view
VALUATION & EXPECTATIONS
Trailing P/E744.4×
Forward P/EN/A
Trailing P/S23.7×
Forward P/S9.6×
EPS beat rate71%
Revenue beat rate29%
Positive window63%

EPS beats: 5 of 7 comparable reports. Positive price windows: 5 of 8.

Market caps may be up to 14 days old; prices up to seven days old; ratios and analyst estimates up to fourteen days old. Forward multiples use consensus for the fiscal year ending 2026-12-31, not the next 12 months. Negative or unavailable earnings multiples show “N/A”. Forward ADR multiples are omitted when the currency/share basis is not reconciled.

50-day average189.46
200-day average179.55
RSI (14)34
20-day range107.13 – 182.34
Relative volume1.0×
1-year change+26.9%
Last eight reported earnings for NBIS
Report dateEPS estimateEPS actualSurpriseResultRevenue actualPrice window*5 sessions*
Aug 12 2026-0.72-0.12+83.3%Beat582.3M+32.0%+15.9%
May 13 2026-0.77-0.23+70.0%Beat399M+23.5%+7.1%
Feb 12 2026-0.58-0.99-70.7%Miss227.7M+10.6%+10.5%
Nov 11 2025-0.56-0.39+29.9%Beat146.1M-14.2%-17.7%
Aug 7 2025-0.50-0.38+24.0%Beat105.1M+24.9%+24.3%
May 20 2025-0.45-0.44+2.2%Beat55.3M+3.6%+5.4%
Feb 20 2025-0.39-0.43-9.3%Miss37.9M-11.2%-28.5%
Oct 31 2024N/A-0.33N/AUnknown43.3M-8.7%-6.3%

*Adjusted close before the report date to the first (or fifth) trading close after it. This window can span two sessions and is not an isolated earnings-day return. Figures may be revised by the provider.

Smart Money activity

Recent insider and politician transactions, and disclosed fund positions for NBIS.

Get Pro to see what insiders are doing ahead of earnings.

Explore insider trades, fund holdings and politician activity with an active Pro membership.

Checking membership…

NBIS earnings previews and market catalysts

Nvidia earnings lift AI shares; Lowe’s margins and gold weigh — November 18, 2026
2026-11-18 · AI shares rebounded before open after Nvidia’s earnings, while Lowe’s fell despite higher sales and gold miners weakened. Take-Two’s game launch and the Fed minutes are the next tests.

Stocks edge higher as earnings and company outlooks shape the November 13 open
2026-11-13 · U.S. stocks pointed higher before the November 13 open, with the S&P 500 ETF up 0.44% as investors weighed company earnings and upcoming business updates.

Nvidia leadership uncertainty weighs on AI stocks as Lilly gains — November 12, 2026
2026-11-12 · Nvidia falls 7.64% before the open as reports of a possible leadership change unsettle AI stocks. Lilly gains after China approves its weight-loss pill; AMD also rises.

CoreWeave earnings revive AI demand hopes before the open — November 11, 2026
2026-11-11 · CoreWeave jumps 16.95% after stronger revenue and a higher outlook. Nebius earnings are the next AI cloud test, while inflation and financing costs remain risks.

All upcoming earnings catalysts →

02 / FINANCIALS

Nebius N.V. financials

Revenue, earnings, cash flow and financial strength in one view.

Reporting currency unconfirmed.

Revenue
Net income
Gross profit
Operating income
EBITDA
Operating cash flow
Capital expenditure
Cash
Total assets
Total liabilities
Shareholder equity
Total debt
Net profit margin
Gross margin
Short interest: days to cover
How to read these financial metrics

Figures use the app’s saved statements for the displayed period, not a trailing-year total. Margins divide profit by revenue; quick ratio uses current assets less inventory divided by current liabilities. Compare dates and currencies before comparing companies.

03 / WHAT COMES NEXT

Nebius N.V. event catalysts

Company earnings and scheduled market events that may change expectations.

2027-02-11

NBIS earnings

Watch reported results, management’s outlook and the share-price reaction.

See earnings expectations ↑
2026-11-188:30 AM ET

Housing starts & building permits

Housing is sensitive to interest rates. Watch permits for indications of future building activity.

Release schedule ↗Scheduled
2026-11-182:00 PM ET · expected

FOMC minutes

Methodology-based date; confirm the Fed calendar closer to release.

Release schedule ↗Rule-based date
2026-11-198:30 AM ET

Initial jobless claims

Use the multiweek trend to distinguish normal volatility from a sustained increase in layoffs.

Release schedule ↗Scheduled
2026-11-2010:00 AM ET

Consumer sentiment · final

Watch changes in inflation expectations as well as sentiment.

Release schedule ↗Scheduled
2026-11-20Contract-specific cutoff

Monthly options expiration

Check your contract. Position unwinds and hedging can affect trading volume.

Release schedule ↗Scheduled
2026-11-20Time not announced

Russell · membership list update

Track revisions before the effective date; index flows do not guarantee a price rise.

Release schedule ↗Scheduled
2026-11-258:30 AM ET

Durable goods orders

Read core capital-goods orders alongside the headline; aircraft orders can create large swings.

Release schedule ↗Scheduled
2026-11-258:30 AM ET

Initial jobless claims

Use the multiweek trend; a single reading can be noisy. Thanksgiving release moves to Wednesday.

Release schedule ↗Scheduled

Dates use U.S. Eastern time and can change. Calendar events provide context; they do not determine the direction of a stock move.

04 / SIDE BY SIDE

Compare NBIS with its peers

Software - Application · Compare valuation, financial strength and price performance.

Companies with valuation data4
Peer median positive P/E112.6×
NBIS P/E744.4×
NBIS peer comparison: valuation
CompanyPriceMarket capP/EForward P/EP/SForward P/S
NBISNebius N.V.2026-11-17 · USD106.0432.16B744.4×23.7×9.6×
0100.HKMiniMax Group Inc
2513.HKZ.AI Co. Ltd.
9903.HKShanghai Iluvatar Corex
CRWVCoreWeave, Inc. Class A Common Stock2026-11-17 · USD49.8933.52B3.4×2.6×
PLTRPalantir Technologies Inc.2026-11-17 · USD156.56397.3B112.6×93.2×54.5×46.8×
SHAZSharonAI Holdings, Inc. Class A Common Stock2026-11-18 · USD23.60831.76M269.2×8.0×
NBIS744.4×
PLTR112.6×

The peer median excludes the selected stock and is based on 1 available positive multiples. P/E median excludes negative or missing earnings multiples. Peer reports can have different fiscal periods and currencies; values are not currency-converted.

05 / PEER ANALYSIS

Explore NBIS alongside its peers

Internet Content & Information · 19 companies · Cached market data

Comparison

Compare companies

Tap a bubble to inspect a company, then × to hide it. Undo restores the last company hidden. Bubble area reflects market cap, with a minimum size for visibility.

Price / sales
0.0×08.8×1.31T17.6×2.62T26.4×3.93TGOOGL · Alphabet Market cap: 3.51T Price / sales: 7.4×META · Meta Platforms Market cap: 1.61T Price / sales: 6.7×BIDU · Baidu Market cap: 27.39B Price / sales: 1.5×PINS · Pinterest Market cap: 10.55B Price / sales: 2.3×NBIS · Nebius Group N.V. Market cap: 32.16B Price / sales: 23.7×Hide NBIS · Undo restores itMarket cap
NBISNebius Group N.V.

Market cap: 32.16B
Price / sales: 23.7×

Valuation snapshot: 2026-11-17
5 of 19 companies have both plotted values.

P/S distribution

Trailing price-to-sales multiples · 5 companies

Median P/S6.7×
Middle 50%2.3× to 7.4×
NBIS P/S23.7×
1.3×7.8×

Tap a bar to see the companies in that P/S range. NBIS has a higher P/S than 80% of this group.

14 companies excluded from P/S statistics because sales are non-positive or the saved multiple is missing. Statistics include all valid positive values, including those outside the focused chart range.

Companies

Showing 8 of 19 matching companies · Largest market cap first

  • Market cap 3.51TP/E 14.8×P/S 7.4×Forward P/E Forward P/S Price snapshot: 2026-11-17 · Financials: 2026-09-30
    ↗
  • Market cap 1.61TP/E 21.2×P/S 6.7×Forward P/E Forward P/S Price snapshot: 2026-11-17 · Financials: 2026-09-30
    ↗
  • Market cap 100BP/E P/S Forward P/E Forward P/S Catalog snapshot
    ↗
  • Market cap 32.16BP/E 744.4×P/S 23.7×Forward P/E Forward P/S Price snapshot: 2026-11-17
    ↗
  • Market cap 29.78BP/E P/S Forward P/E Forward P/S Catalog snapshot
    ↗
  • Market cap 27.39BP/E P/S 1.5×Forward P/E Forward P/S Price snapshot: 2026-11-17 · Financials: 2026-09-30
    ↗
  • Market cap 15.6BP/E P/S Forward P/E Forward P/S Catalog snapshot
    ↗
  • Market cap 10.55BP/E 84.3×P/S 2.3×Forward P/E Forward P/S Price snapshot: 2026-11-17 · Financials: 2026-09-30
    ↗

Explore industries

Open an industry for its comparison, valuation and companies.

U.S.-listed companies from the app’s catalog. Medians use saved positive P/E values; coverage and snapshot dates vary.

How this comparison works

Uses the saved companies from the same industry and listing market, including NBIS, ordered by cached market cap. Company snapshots can have different dates; the web cache may cover fewer metrics and periods than the app.

Periods end at each company’s dated price snapshot. Change compares the latest saved observation with one at or before the selected period’s start. A daily price change uses consecutive saved sessions. Financial data updates quarterly, so short periods may show no change. Missing history and zero starting values are excluded; a negative starting value uses its absolute value as the denominator.

Metrics use saved ratios and percentages. Market caps use the listing market’s reporting currency; underlying financial statements may use different currencies. Circle sizes have a minimum for touch visibility, and an outlined circle indicates a missing market cap. These comparisons describe data, not recommendations or price predictions.

INDUSTRY COMPARISON

NBIS industry peers

Internet Content & Information · Oct 16, 2026 · Closing-price performance

Compare NBIS with 3 other stocks in the available heatmap coverage.