First Solar rises pre-market as election results lift hopes for solar policy support

What is behind the stock move?
Solar stocks rallied following Democratic victories in both chambers of Congress. Bloomberg reported investors were betting the outcome could slow or reverse measures targeting clean-energy projects, while Reuters also reported broad solar gains. For First Solar, possible support for domestic solar production matters because manufacturing tax credits affect production economics. This is a policy expectation, not a newly enacted subsidy or a new company contract.
Latest company research
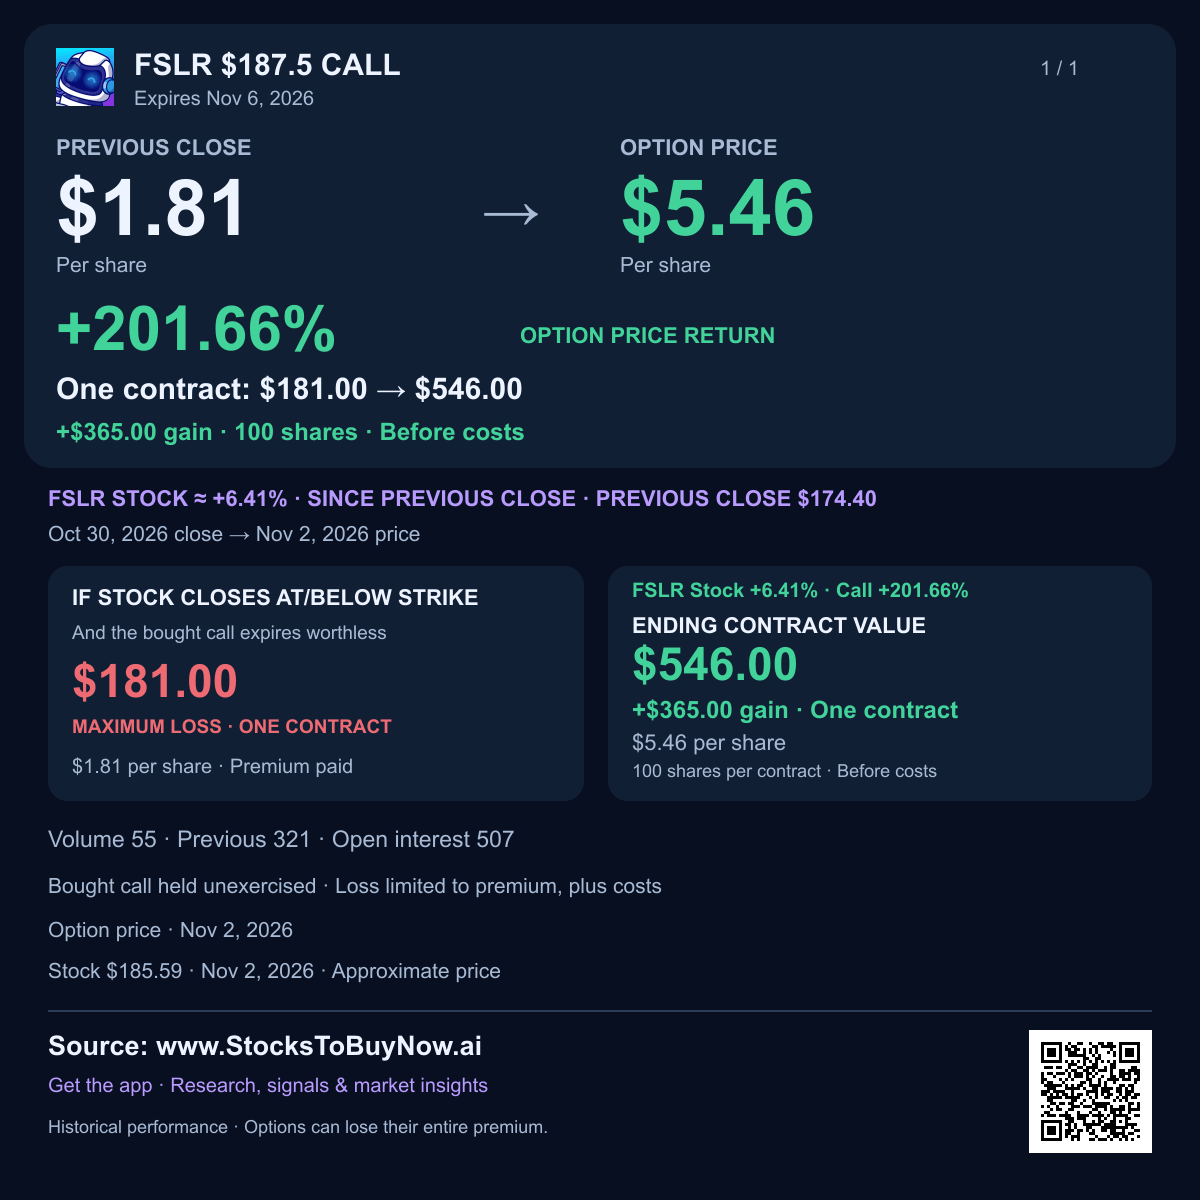
First Solar rose as election results lifted hopes for support for solar energy. FSLR was up about 7.7% before open on November 4 compared with the previous close.
- Democrats won control of Congress, and solar shares rallied together. Investors are reconsidering the outlook for clean-energy policy under a divided government.
- First Solar makes thin-film solar panels for large power projects. Domestic manufacturing tax credits can lower its effective production costs and support profit.
- The policy benefit remains an expectation. Congressional control alone does not change the law, and the timing and scope of future action remain uncertain.
- In its October 29 earnings report, quarterly sales fell 23% to $1.23 billion. Standard-accounting profit per share rose 25% to $5.3, showing that sales and profit moved in different directions.
- First Solar cut its 2026 sales outlook to $4.6–4.9 billion from $4.9–5.2 billion. Delivery timing and customer demand still matter alongside the policy story.
- The company had 44 gigawatts of contracted panel sales at September 30. That future business offers visibility, but contract changes and delivery delays remain risks.
Watch concrete policy proposals and progress on deliveries next. The pre-market rise could reverse; the technical charts show the completed November 3 trading session.
Financials and technicals
Charts through Nov 3, 2026. The session move above may reflect later news.
Technical setup and risks
The November 3 close was $185.9, above the 20-day average near $176.87 but below the 50-day average near $187.62. RSI, a momentum gauge, was 56.1. Approximate support at $168–173.90 reflects October 22–30 lows; resistance at $186.2–188.70 reflects October 13 and November 2–3 highs. Holding above that resistance would support the recovery; falling back below it would weaken the pre-market breakout. Policy uncertainty, customer delivery schedules and volatile early trading are the main near-term risks.
AI-assisted research with source and calculation checks. Prices may be delayed. Technical charts use the stated completed session, which can precede the quoted intraday move. Educational information; investing involves risk.