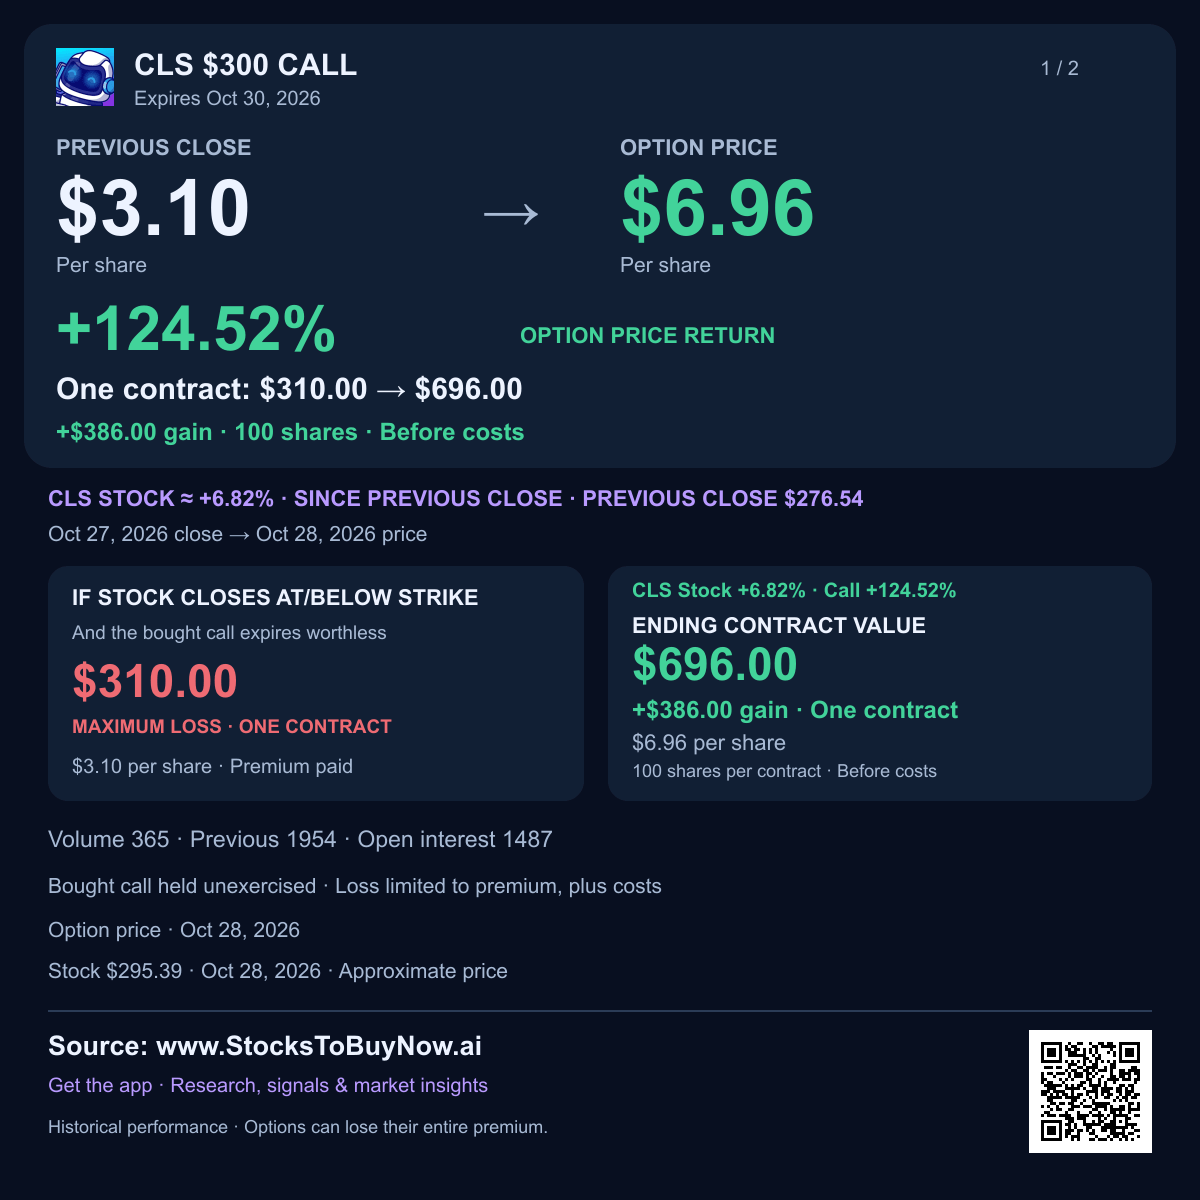
Celestica extends its rebound as a $40 billion sales outlook raises the stakes
Earnings results
- EPS beat +11.1%
Actual: $3.3 · Cons.: $2.97 (adjusted diluted EPS)
- Revenue beat +6.8%
Actual: $5.8297B · Cons.: $5.46B (GAAP revenue in USD)
- Guidance
Raised FY2026 adjusted EPS to $11.55 from $11.30; issued FY2027 adjusted EPS outlook of $21.50.
Earnings and the stock move
Celestica extended its rebound on October 28 following a strong October 27 response to results released on October 26. The dated results showed rapid cloud and connectivity growth, while management issued a 2027 revenue outlook of $40 billion and adjusted EPS outlook of $21.5. These are company forecasts, not completed orders or guaranteed revenue. Our analysis: the larger opportunity raises the importance of production ramps, customer concentration and cash investment; the reduced 2026 free-cash-flow outlook shows the cost of preparing for growth. The October 26 release is recent context for the ongoing rebound, not a newly released October 28 event.
Q3 2026 earnings recap
Celestica extended its rebound, rising 6.72% to $295.12 on October 28, 2026. Its October 26 earnings report set a $40 billion sales outlook for 2027, putting a much larger business within management’s sights.
- Celestica designs and builds networking and computing hardware for data-center customers, alongside industrial and other electronics. Third-quarter revenue rose 83% to $5.83 billion.
- Adjusted EPS, or profit per share excluding specified items, reached $3.3 versus a $2.97 estimate: an 11.1% beat. Reported GAAP profit per share was $3.26.
- Management raised its 2026 revenue outlook to $21 billion from $20.5 billion and adjusted profit outlook to $11.55 per share from $11.3. The initial 2027 sales outlook implies roughly 90% growth.
- Cloud and connectivity revenue doubled to $4.87 billion as demand for data-center hardware expanded. Company-wide adjusted operating margin rose to 8.5% from 7.6%, helping sales growth translate into profit.
- The expansion needs cash: the 2026 free-cash-flow outlook fell to $460 million from $600 million to support growth. Management expects $1.5–$2 billion of capital spending in 2027, raising execution and funding demands.
- The stock gained 12.12% on October 27, the first full day following the report. The rebound is still below the completed chart’s 20-day and 50-day moving averages, so longer-term trend repair remains unfinished.
Watch whether customer programs move into production on schedule. Holding above $283 and reclaiming $296–$315 would support recovery; losing the recent range below $261.5 would weaken it.
Financials and technicals
Charts through Oct 27, 2026. The session move above may reflect later news.
Technical setup and risks
The October 27 rebound followed earnings but remained below SMA20 and SMA50. Holding above $283 and reclaiming $296–$315 would strengthen recovery; a close below $261.5 would weaken the recent range. Large customer deployment delays, component shortages and capital-spending demands are risks.
AI-assisted research with source and calculation checks. Prices may be delayed. Technical charts use the stated completed session, which can precede the quoted intraday move. Educational information; investing involves risk.