WDC · EARNINGS RESULTS · October 22, 2026
Why Western Digital (WDC) Stock Is Down After Hours: Q1 FY2027 Earnings
$335.99 · Snapshot as of
Earnings and the stock move
Western Digital fell in October 22 after-hours trading after releasing fiscal first-quarter 2027 results that evening. The issuer has released the quarter; the observed market reaction does not identify a single cause.
Q1 FY2027 earnings recap
Western Digital fell in October 22 after-hours trading after releasing fiscal first-quarter 2027 results that evening.
- Revenue reached $4.381 billion, rising 55% from $2.818 billion a year earlier and 17% from the prior quarter.
- GAAP diluted EPS was $4.63 and adjusted diluted EPS was $4.64, versus $3.07 and $1.78 a year earlier.
- Adjusted gross margin reached 58.1% and adjusted operating margin reached 49.1%.
- Operating cash flow totaled $1.60 billion, while free cash flow was $1.38 billion.
- Second-quarter guidance calls for $5.0–$5.2 billion of revenue, 60%–61% adjusted gross margin and $5.60–$6.00 adjusted EPS.
- The quarterly dividend increased 17% to $0.175 per share, payable December 17 to holders of record on December 4.
Strong reported growth and a lower share price can coexist; cloud demand, pricing, customer concentration and expectations remain key risks.
Financials and technicals
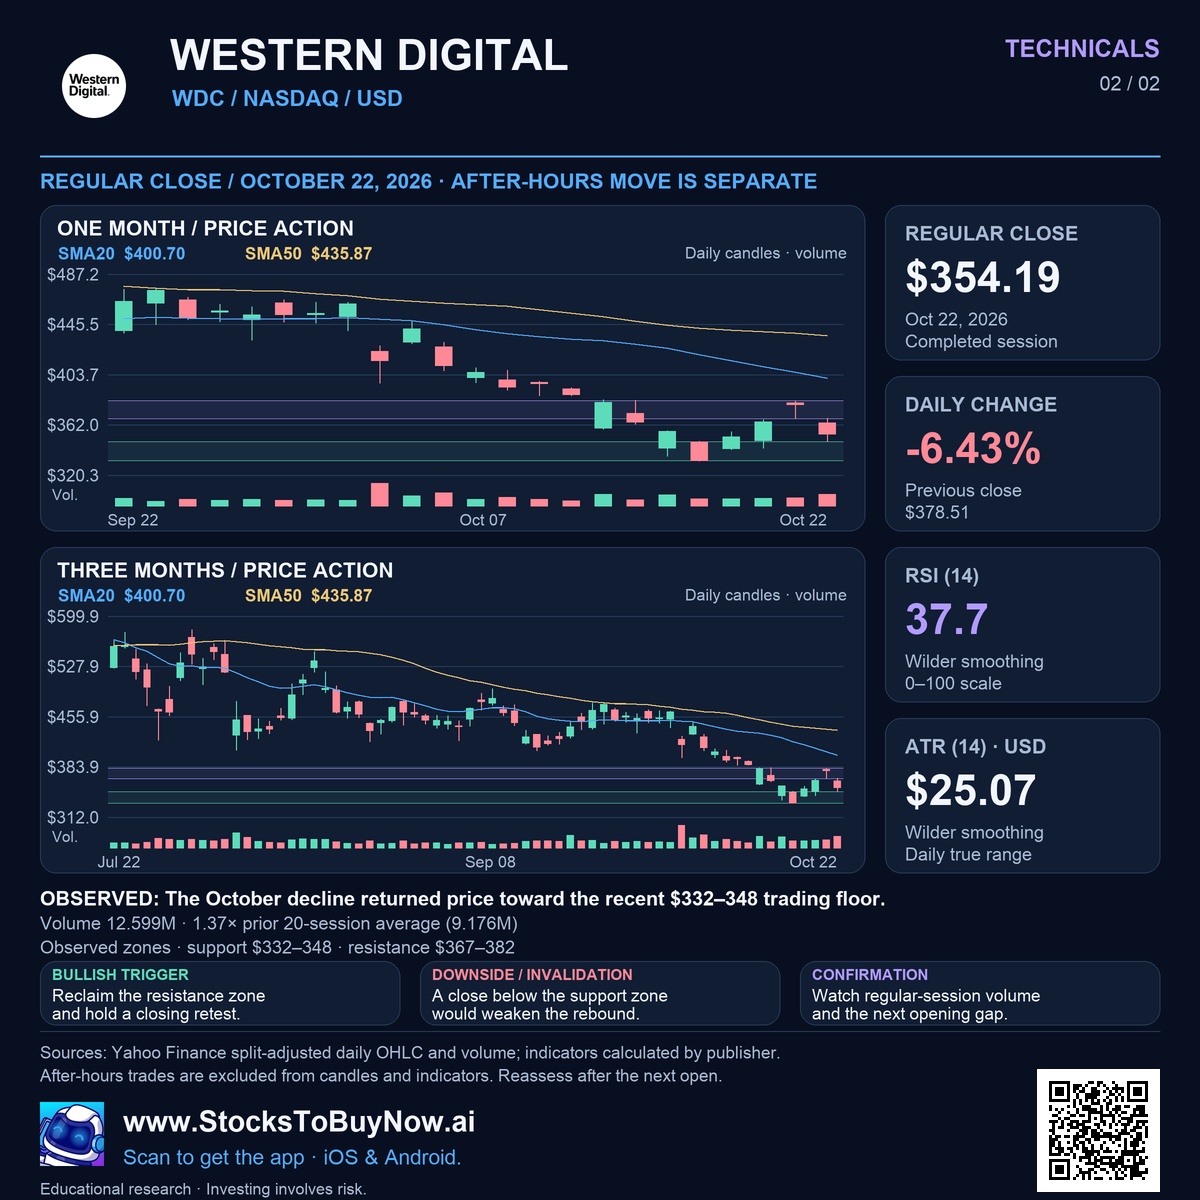
Technical charts use the October 22, 2026 completed close. The session move above may reflect news released after that close.
Financials
Technicals
Western Digital (WDC) stock information
Sells high-capacity HDD storage to cloud, enterprise and device customers.
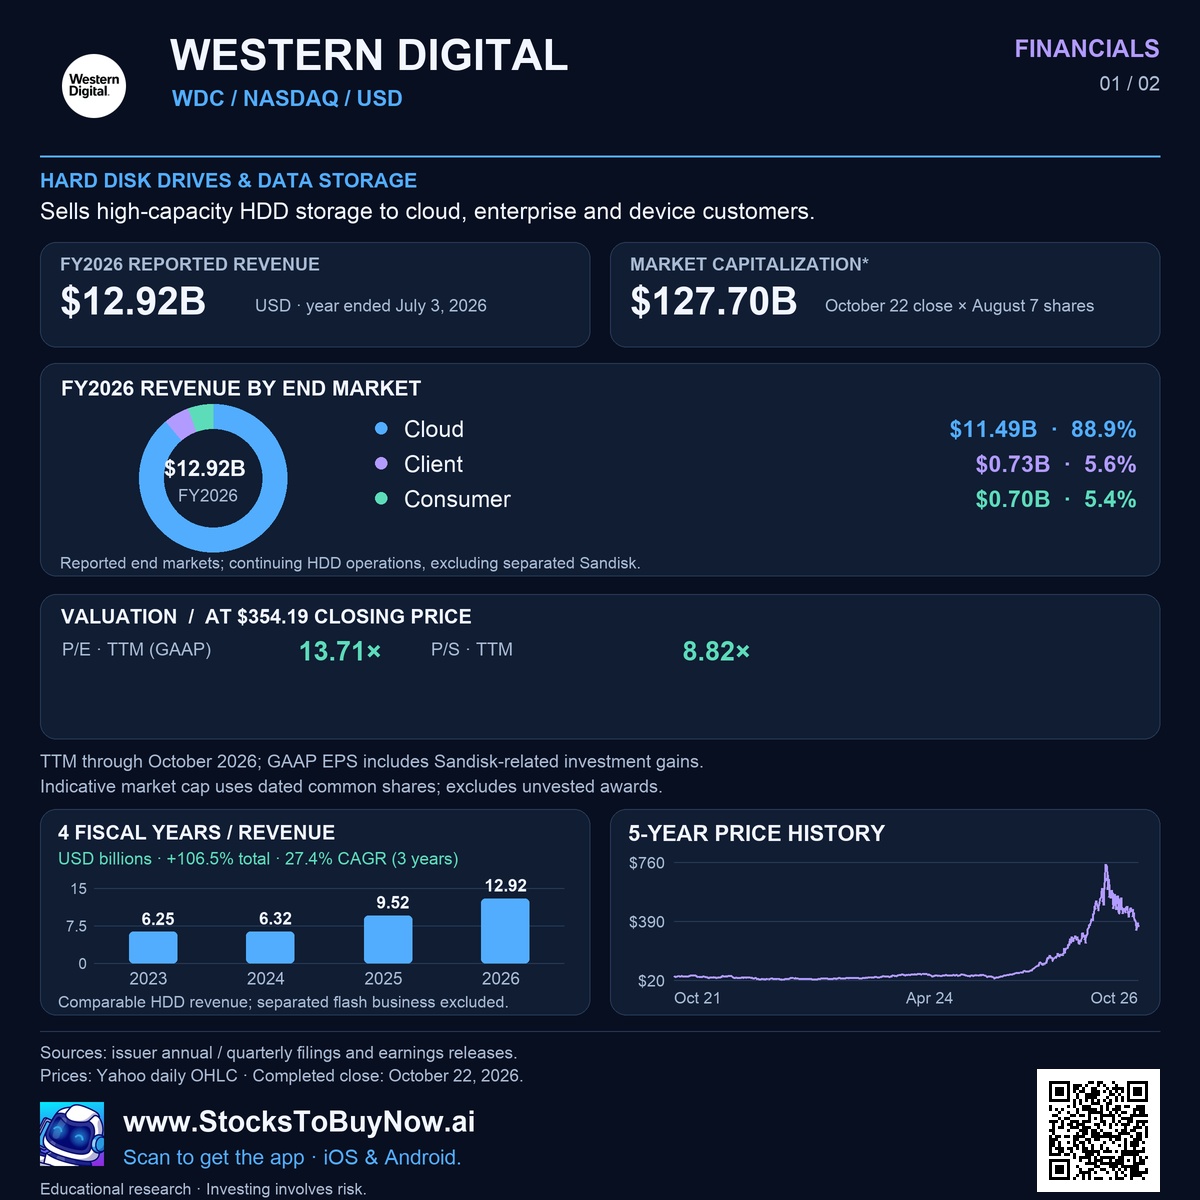
HARD DISK DRIVES & DATA STORAGE. Financial and valuation snapshot at the October 22, 2026 completed close; estimates and reporting dates are shown in the financial infographic.
- Completed close · October 22, 2026
- $354.19
- Indicative market capitalization
- $127.70 billion
- FY2026 revenue
- $12.92 billion
- P/E · TTM GAAP
- 13.71×
- RSI (14) · October 22, 2026
- 37.7
Explore Western Digital stock financials, earnings and research →
Technical setup and risks
The October decline returned price toward the recent $332–348 trading floor. Observed zones · support $332–348 · resistance $367–382. A closing reclaim of resistance would strengthen the setup; a close below support would weaken it. Confirm using regular-session volume and retests. These are observed zones, not guaranteed turning points. After-hours trades are excluded from the technical chart.
Follow the research in the app
Open this report and follow the discussion.
Open WDC research in the app →