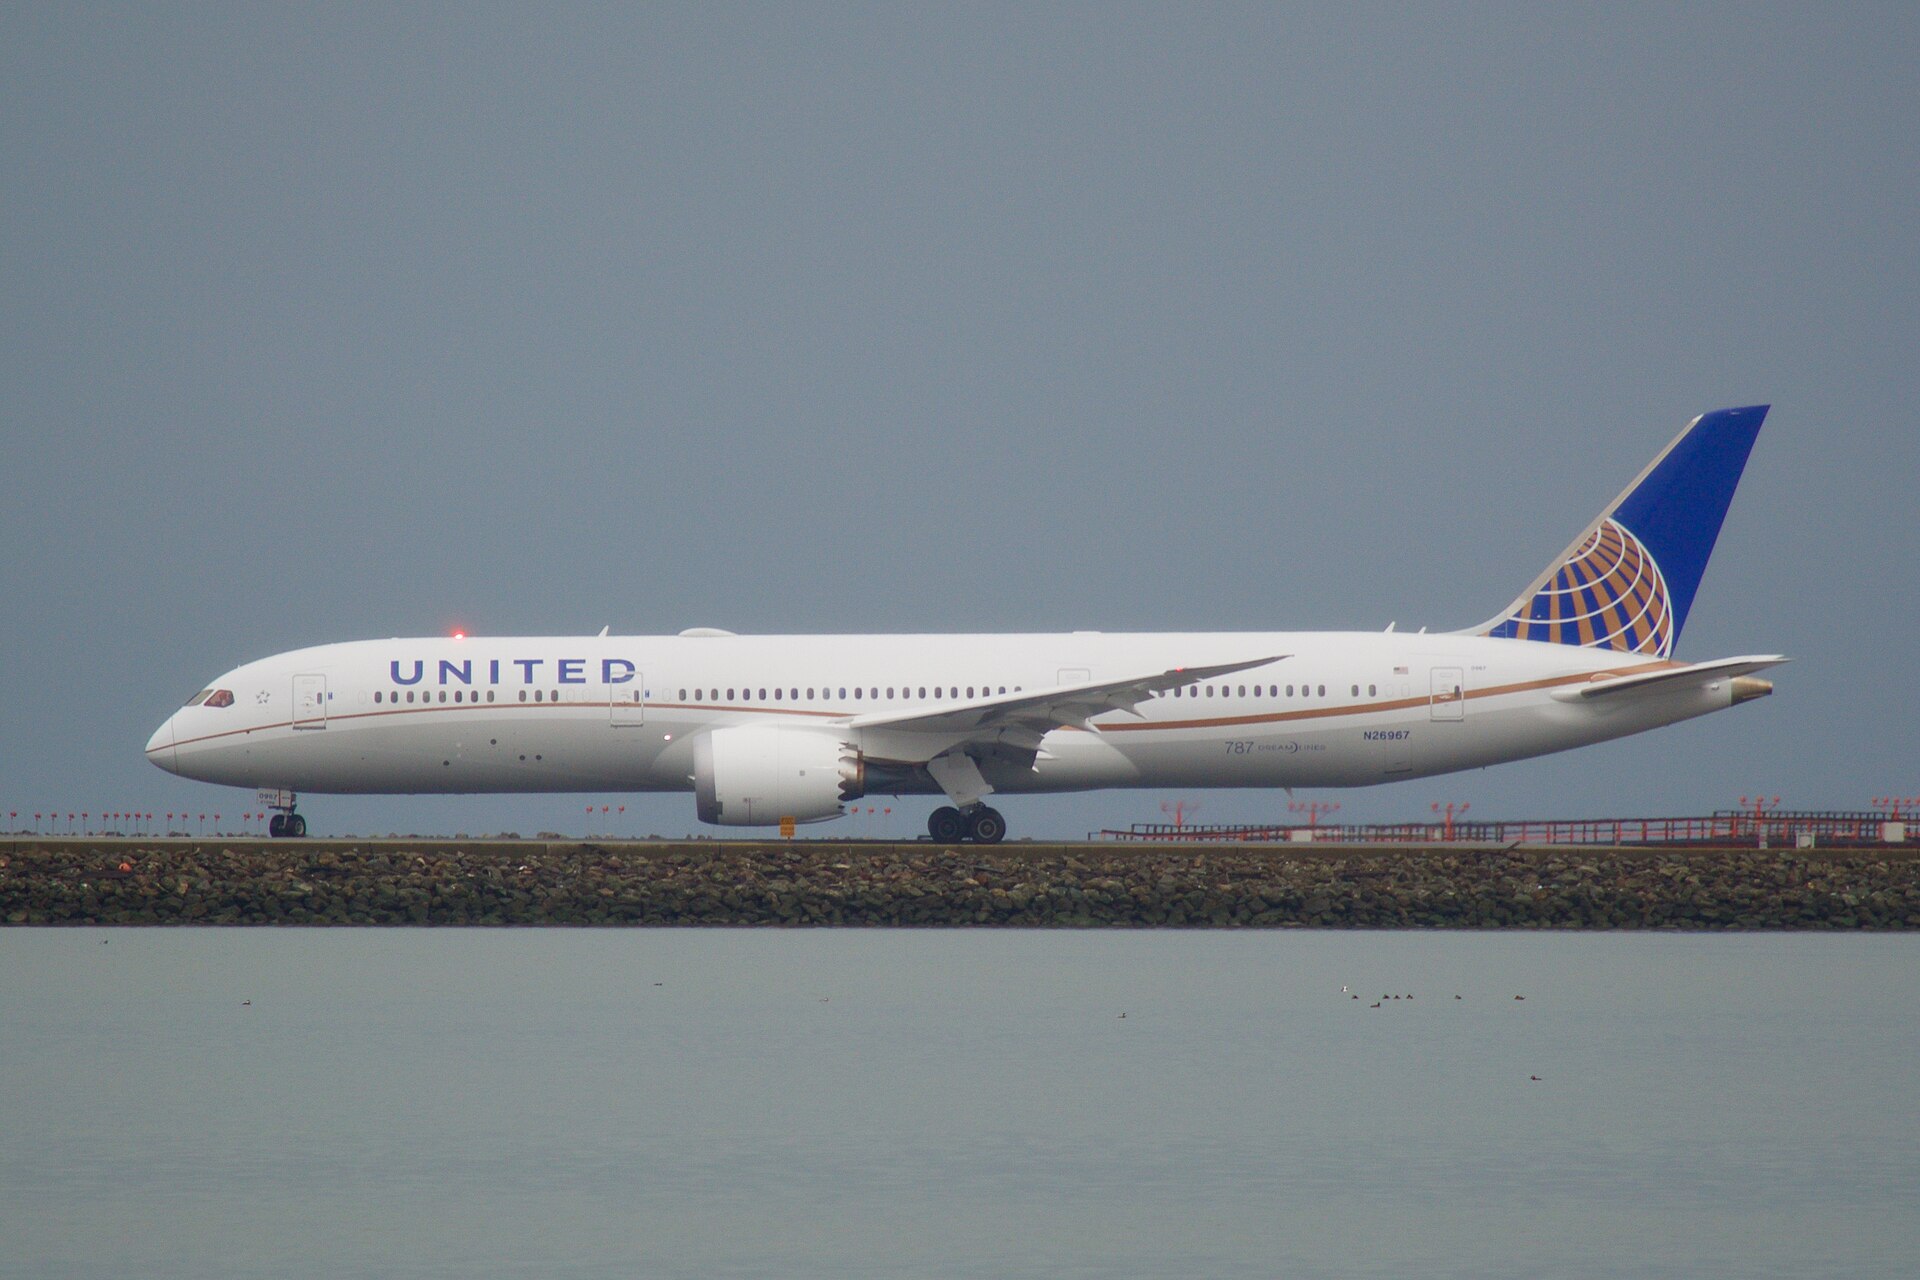
United Airlines rises as oil falls, putting fuel costs back in focus
What is behind the stock move?
Crude oil declined about 4% on November 2 amid renewed diplomatic efforts involving Iran and Qatar. Full AP reporting, syndicated by WPTF, and Reuters reporting, syndicated by MarineLink, were opened and reviewed. United’s September-quarter filing shows aircraft fuel expense of $4.84 billion versus $3 billion a year earlier, establishing the concrete economic relevance of lower fuel prices. United shares rose during trading; lower crude is a potentially supportive sector development, rather than proof that every part of the share-price move has one cause. Jet-fuel pricing, fares and demand will determine any realized margin benefit. The discussions are conditional, not a completed peace agreement or confirmed reopening of shipping routes.
Latest company research
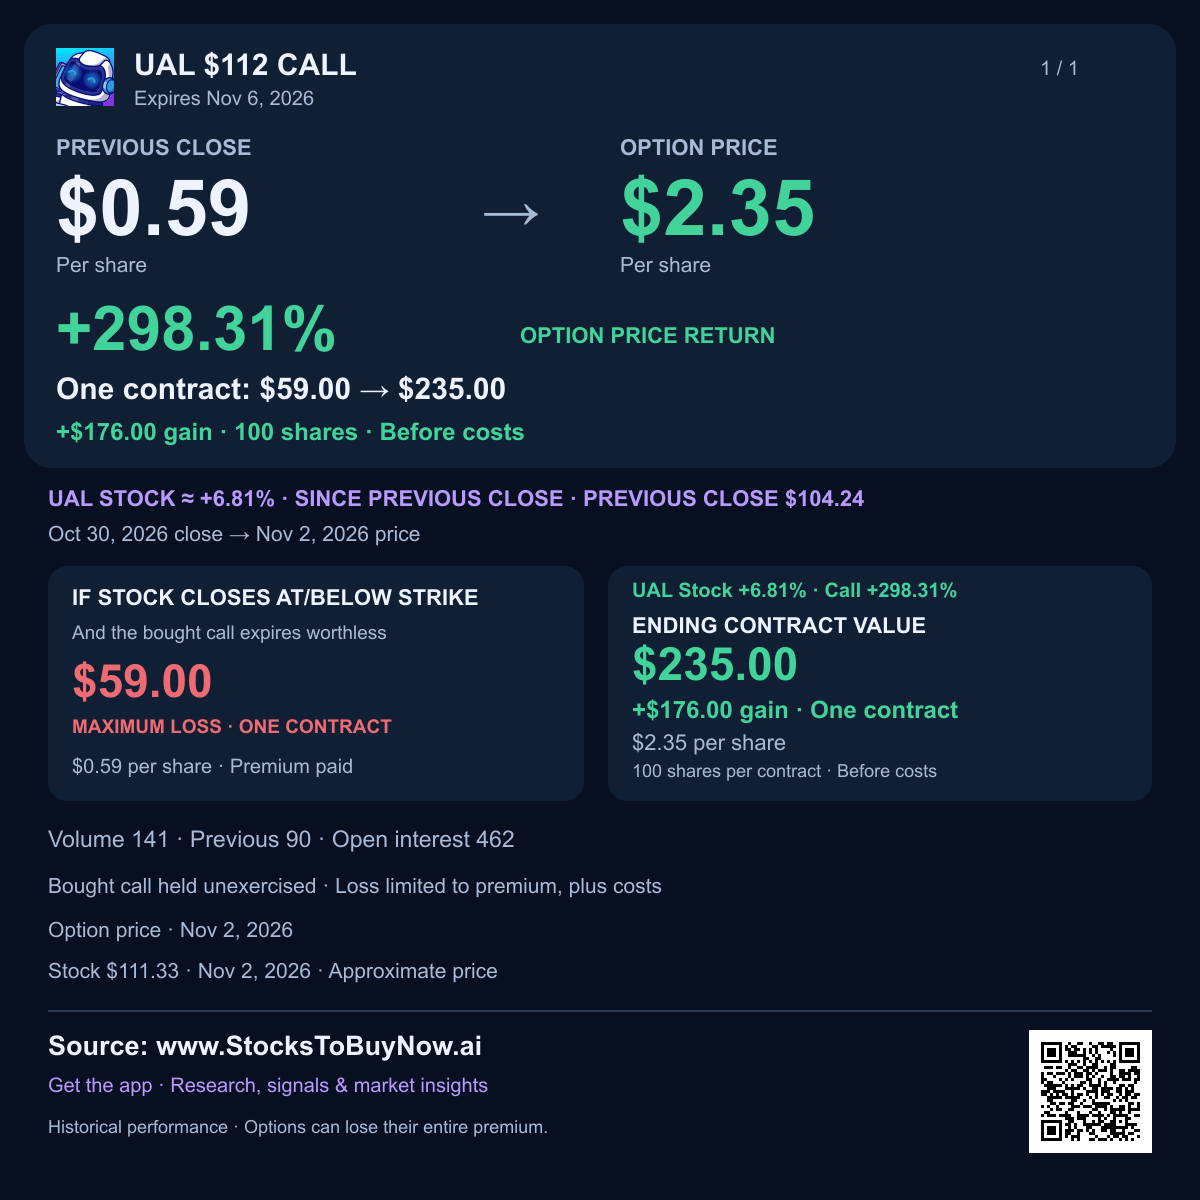
United Airlines traded at $110.8, up 6.29% during trading on November 2, as lower oil prices put relief from fuel costs back in focus.
- Crude oil fell about 4% earlier on November 2 as diplomatic efforts raised hopes of easing Middle East supply disruptions. Cheaper crude could help airlines, although jet-fuel prices and fares determine the benefit.
- United spent $4.84 billion on aircraft fuel in the September quarter, compared with $3 billion a year earlier. That makes sustained fuel-cost relief meaningful for margins.
- The airline earns most of its revenue from passenger travel, alongside cargo and loyalty-related income. Lower fuel costs help only if ticket pricing and demand remain resilient.
- Its September-quarter filing showed $17.88 billion of revenue and reported profit of $3.14 per share. These are previously reported results, providing context for the fuel-cost sensitivity.
- Diplomatic discussions remain conditional, with no completed peace settlement established in the reporting reviewed. Renewed conflict or shipping disruptions could reverse the oil-price relief.
- The completed October 30 chart closed at $104.24. Holding above the earlier $105–107 high area would strengthen the rebound; the $94.5–98 low area remains a downside reference.
Watch jet-fuel prices, ticket demand and whether the rally holds through later trading. Wage costs, capacity limits and operational disruptions can offset savings from cheaper oil.
Financials and technicals
Charts through Oct 30, 2026. The session move above may reflect later news.
Technical setup and risks
October 30 completed close $104.24; SMA20 $103.21, SMA50 $107.65, RSI49.1 and ATR$4.48. Prior high area$105–107 derives from October27–29 highs; the new intraday move is above that area, but a sustained close/retest is needed to establish a durable breakout. Support$94.5–98 reflects repeated October14–23 lows. These are reference zones, not guaranteed turning points.
AI-assisted research with source and calculation checks. Prices may be delayed. Technical charts use the stated completed session, which can precede the quoted intraday move. Educational information; investing involves risk.