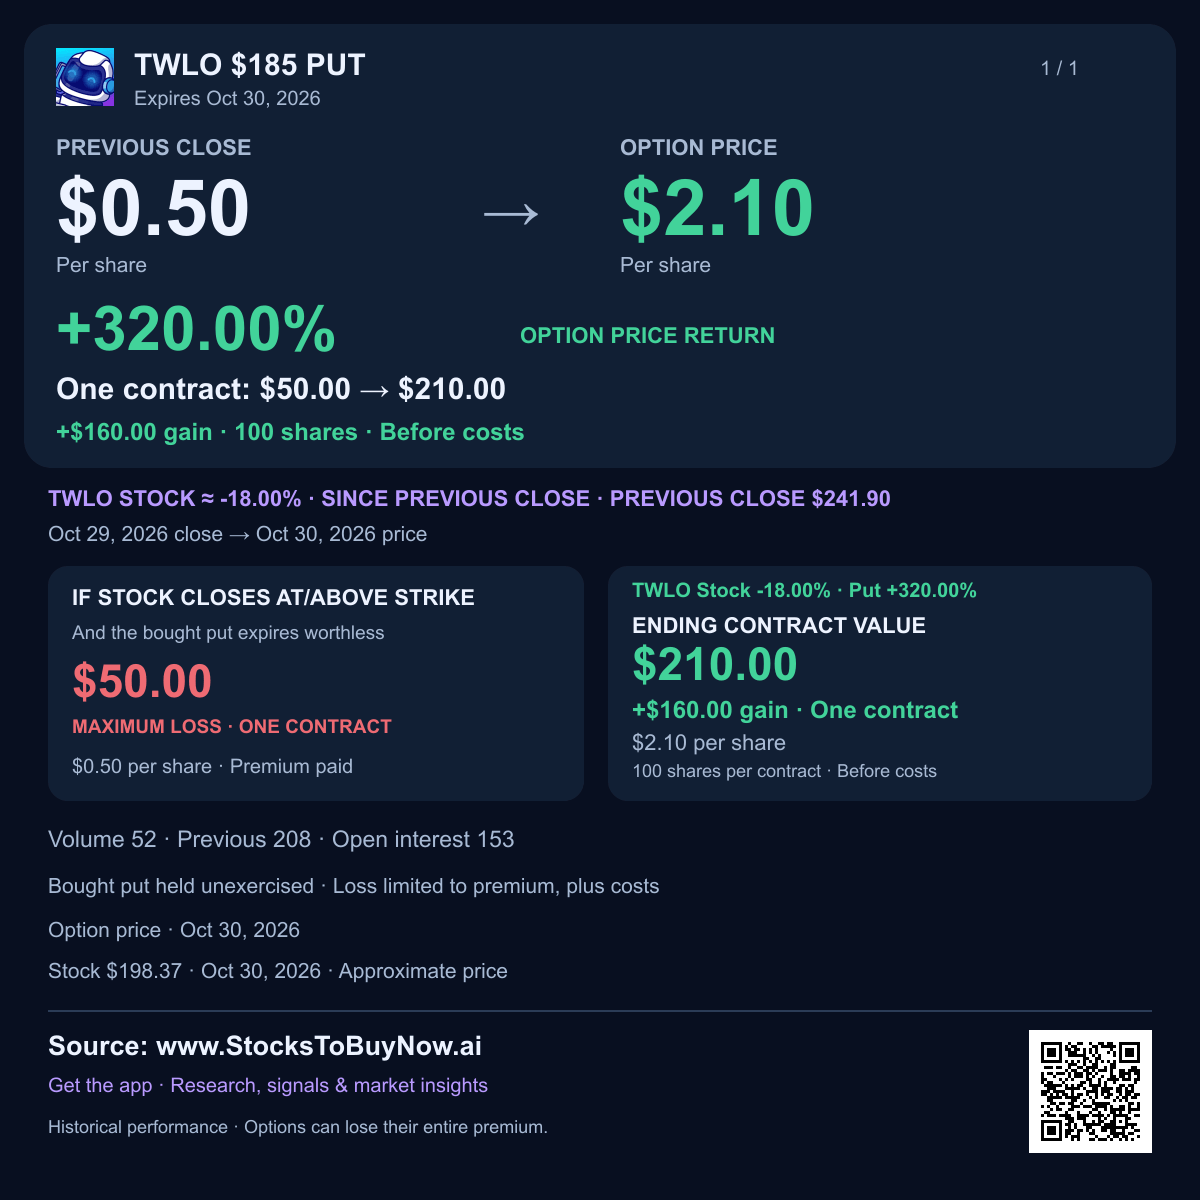
Twilio falls despite an earnings beat as its outlook signals slower growth
Earnings results
- EPS beat +12.2%
Actual: $1.65 · Cons.: $1.47 (non-GAAP diluted EPS)
- Revenue beat +2.6%
Actual: $1.55954B · Cons.: $1.52B (reported revenue)
- Guidance
Issued Q4 organic revenue growth of 11%–12%, versus Q3 growth of 16%; raised FY2026 adjusted operating income to $1.19–$1.20 billion from $1.135–$1.155 billion

Earnings and the stock move
The earnings beat and higher full-year forecast were outweighed by concern about next-quarter momentum. Twilio expects slower organic growth and lower adjusted operating profit than in the third quarter. Messaging is its largest product group, making sustained customer usage central to the investment case. Strong cash generation offers flexibility, but competition, carrier fees and variable demand can pressure margins.
Q3 2026 ended September 30 earnings recap
Twilio fell 18.2% during trading on October 30, 2026 as investors focused on slower growth ahead despite an earnings beat.
- Third-quarter adjusted EPS, or profit per share, reached $1.65 versus $1.47 expected. GAAP EPS was $1; adjusted profit excludes costs such as stock-based compensation.
- Revenue rose 20% to $1.56 billion, above the $1.52 billion forecast. Twilio earns revenue by helping businesses send messages, make calls and communicate with customers.
- Fourth-quarter organic revenue growth is expected to slow to 11%–12% from 16% in the third quarter. This measure excludes acquisitions, divestitures and certain carrier-fee increases.
- Adjusted operating profit is forecast at $300–$310 million next quarter, below the third quarter’s $325.7 million. Slower growth could make it harder to spread costs across a larger revenue base.
- Twilio still raised its full-year adjusted operating profit forecast to $1.19–$1.2 billion from $1.14–$1.16 billion. Its fourth-quarter revenue forecast also exceeded consensus, so the concern centers on growth momentum.
- Third-quarter free cash flow reached $369.6 million, providing cash for investment and buybacks. Continued customer spending and cost control will matter if growth slows.
Watch whether messaging demand and new products sustain growth as comparisons get tougher. Competition and customer usage remain risks; the charts end at the October 29 close, before earnings.
Financials and technicals
Charts through Oct 29, 2026. The session move above may reflect later news.
Technical setup and risks
The completed October 29 charts precede earnings. Following the price gap, the former $233–$242 low area is overhead, not established current support. Regaining that range would begin repairing the decline; a new trading range needs time to develop.
AI-assisted research with source and calculation checks. Prices may be delayed. Technical charts use the stated completed session, which can precede the quoted intraday move. Educational information; investing involves risk.