T-Mobile rises after earnings as higher customer spending lifts its cash outlook
Earnings results
- EPS
$3.22 GAAP diluted profit per share; no verified matched-basis consensus comparison
- Revenue beat +1.9%
$23.584B vs $23.15B expected
- Guidance
Raised adjusted free cash flow midpoint by $150M; $18.7–$18.8B vs $18.4–$18.8B previously

Earnings and the stock move
T-Mobile’s October 28 earnings report showed customers spending more per account and postpaid service revenue growing faster than total service revenue. That helps recurring sales support cash generation even as new account additions slow. The company raised the midpoint of its annual adjusted cash outlook, supporting the case for continued shareholder returns. The next test is whether it can preserve that spending growth while limiting cancellations and funding its network.
Q3 2026 ended September 30 earnings recap
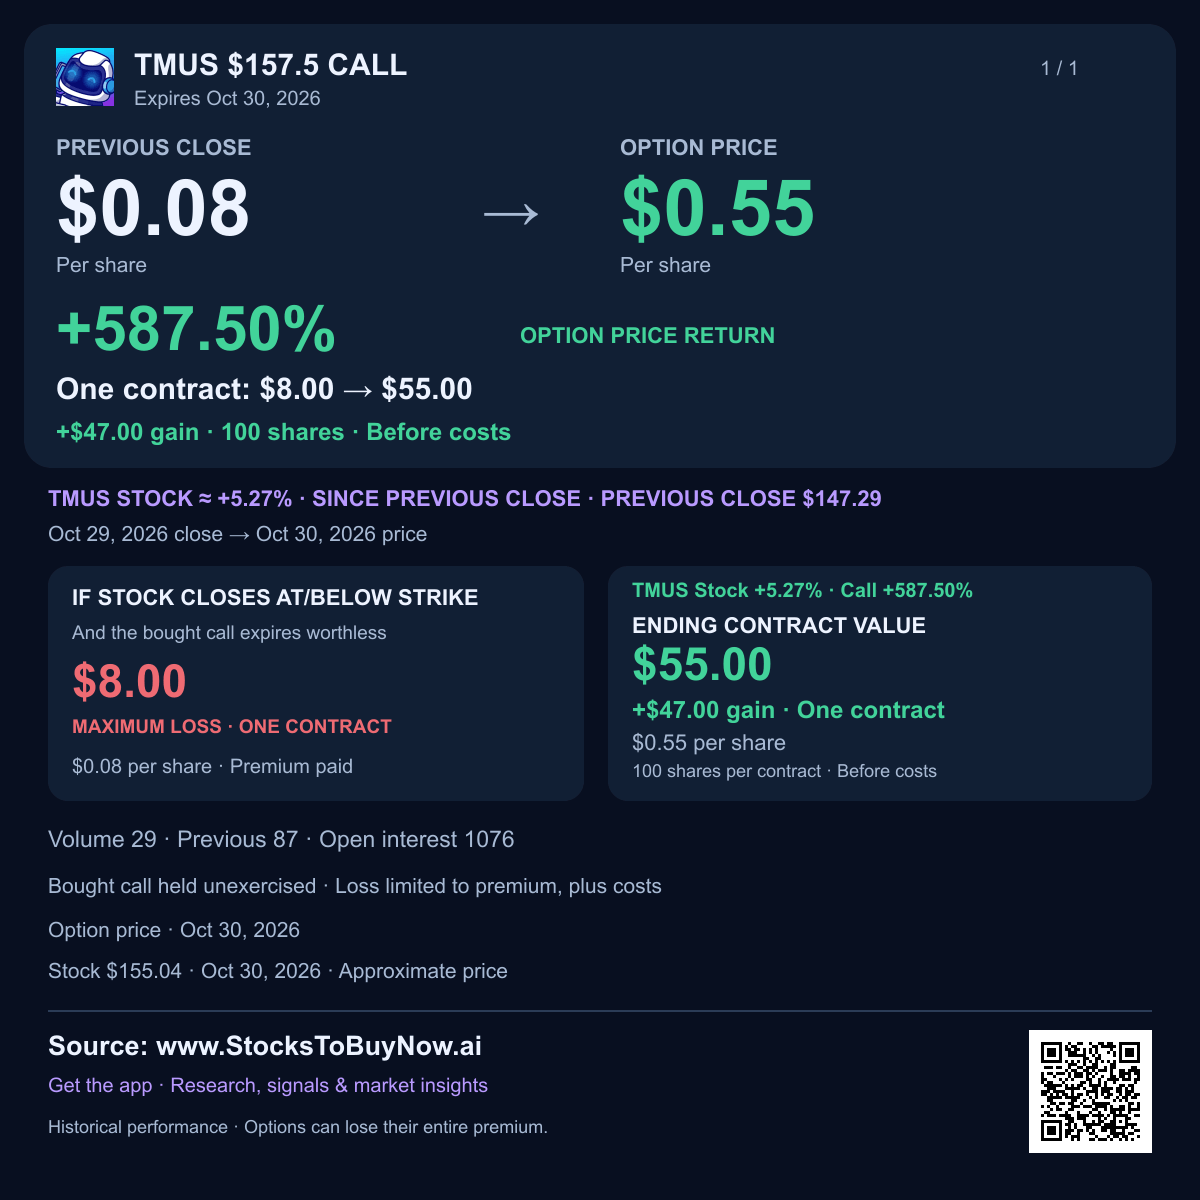
T-Mobile rose 7.0% during trading on October 30, 2026, following its October 28 earnings report. Higher spending per customer account helped lift the full-year cash outlook.
- Third-quarter revenue reached $23.58 billion, above $23.15 billion expected. GAAP EPS, or profit per share, was $3.22, up from $2.41 a year earlier.
- Postpaid service revenue grew 9% to $16.3 billion. Average monthly revenue per account increased 4% to $155.73, showing existing customer relationships are generating more sales.
- The company added 274,000 postpaid accounts, down from 396,000 a year earlier. The monthly account cancellation rate rose to 1.09% from 0.97%, making customer retention a key test.
- Adjusted free cash flow, cash left after capital spending, rose 5% to $5.07 billion. Operating cash flow fell 2%, while lower capital spending helped the remaining cash grow.
- T-Mobile raised the midpoint of its full-year adjusted free cash flow outlook by $150 million. The new range is $18.7–$18.8 billion versus $18.4–$18.8 billion, with the upper end unchanged.
- The company returned $3.5 billion to shareholders in the quarter through buybacks and dividends. Strong cash generation supports those returns, while network investment and debt remain competing demands.
Watch whether spending per account can keep growing without more customer departures. Competition and UScellular integration remain risks; the charts end at the October 29 close and exclude October 30 trading.
Financials and technicals
Charts through Oct 29, 2026. The session move above may reflect later news.
Technical setup and risks
The October 29 completed charts show a prior low area around $144–$147 and repeated rebounds around $155–$160. October 30 trading has moved back into that upper area. Sustained closes above it would strengthen the recovery; a return below $144–$147 would weaken it. These are approximate historical areas, not guaranteed turning points.
AI-assisted research with source and calculation checks. Prices may be delayed. Technical charts use the stated completed session, which can precede the quoted intraday move. Educational information; investing involves risk.