
Share Why Seagate Technology (STX) Stock Is Down After Hours
← Stock movers news
Market movers
Seagate TechnologySTX · Computer Hardware
STX · October 22, 2026After close · Since the same-day regular close
-2.87%Session snapshot

Why Seagate Technology (STX) Stock Is Down After Hours
120
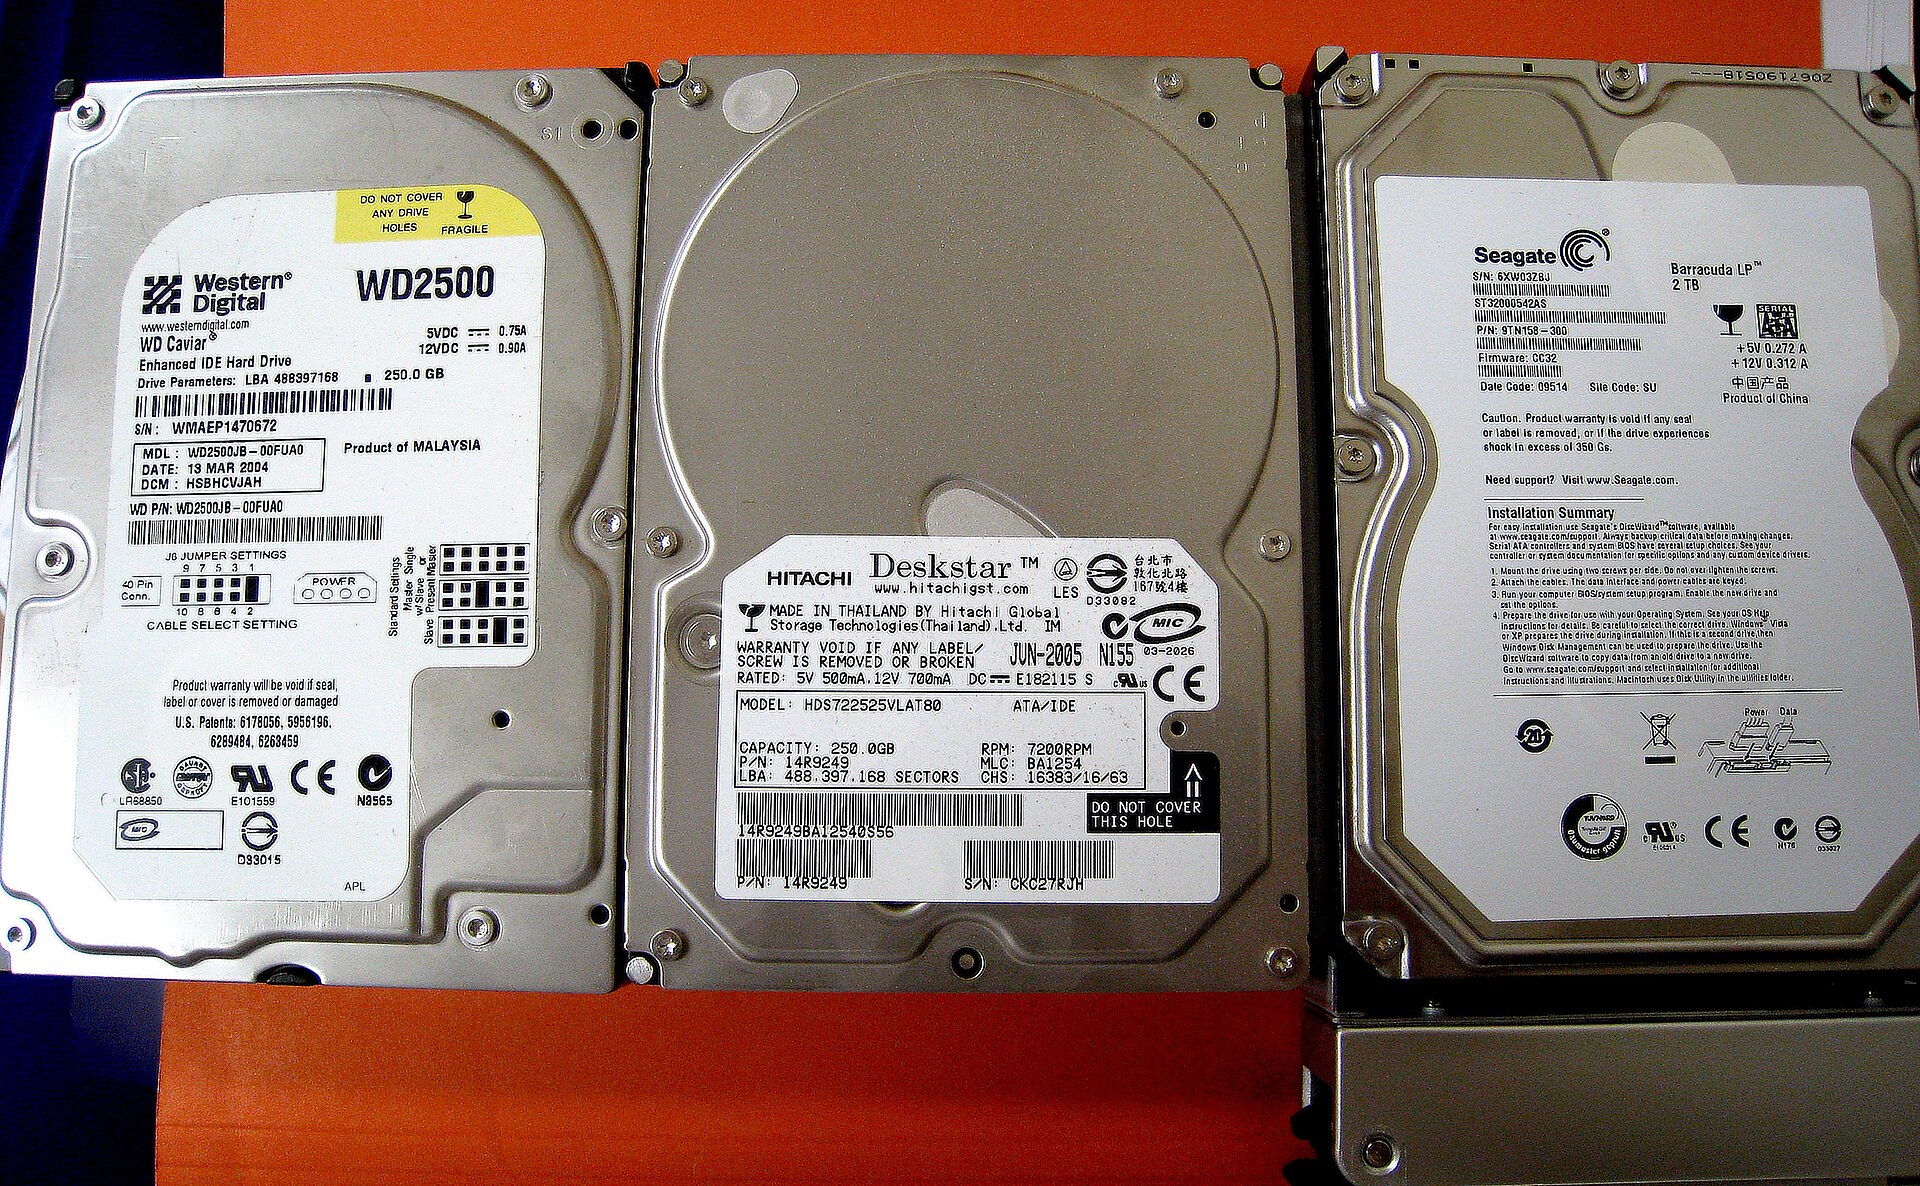
Three older hard disk drives from Western Digital, Hitachi and Seagate
Archive illustration: Western Digital, Hitachi and Seagate hard drives photographed in October 2009. These older products do not depict current HAMR or data-center models. Photo: uıɐɾ ʞ ʇɐɯɐs / Wikimedia Commons · CC BY-SA 2.0 · Wikimedia-supplied thumbnail; displayed with a responsive crop.
THE CATALYST

What is behind the stock move?

Seagate fell in October 22 after-hours trading ahead of its fiscal first-quarter 2027 report scheduled for October 27 after the close. The earnings timing is verified; no same-evening issuer earnings release is being asserted.

AT A GLANCE

Latest company research

Seagate fell in October 22 after-hours trading ahead of its fiscal first-quarter 2027 report scheduled for October 27 after the close.

  • The latest reported quarter delivered $3.63 billion in revenue, with $5.58 GAAP EPS and $5.71 adjusted EPS.
  • Fiscal 2026 revenue reached $12.2 billion, up 34%, with $13.9 GAAP EPS and $15.58 adjusted EPS.
  • Fiscal-year free cash flow reached $3.1 billion, while operating cash flow totaled $3.7 billion.
  • July guidance for the upcoming quarter called for $4–$4.2 billion in revenue and $7.1–$7.5 adjusted EPS.
  • Data-center customers represented 80% of fiscal 2026 revenue, making cloud storage demand central to the business.
  • Western Digital released results this evening, providing relevant storage-industry context before Seagate reports its own numbers.

Cloud capital spending, customer concentration, storage pricing and HAMR execution remain risks; tonight’s move is not a Seagate earnings release.

THE VISUAL RESEARCH

Financials and technicals

Charts through October 22, 2026. The session move above may reflect later news.

Financials
Technicals
WHAT TO WATCH

Technical setup and risks

The regular close tests the $629–642 floor after a sharp October reversal. Observed zones · support $629–642 · resistance $675–692. A closing reclaim of resistance would strengthen the setup; a close below support would weaken it. Confirm using regular-session volume and retests. These are observed zones, not guaranteed turning points. After-hours trades are excluded from the technical chart.

After-hours move is measured versus the same-day regular close across the saved largest-100 S&P 500 universe. AI-assisted research with source and calculation checks. Price snapshots may be delayed. Technical charts use the stated completed session, which can precede the quoted intraday move. Educational information; investing involves risk.
EXPLORE COMPANY RESEARCH

Seagate Technologys: the full stock picture

Earnings history, financials, price action and peer comparisons — all below.
Open STX stock page ↗

EXPLORE THE COMPANY

Seagate Technologys (STX)

Explore earnings, price action, financials and industry comparisons.

Symbol
STX
Sector
Technology
Industry
Computer Hardware
Instrument type
EQUITY

Profile information from our saved company catalog. This is not a live quote or confirmation of current listing status.

EARNINGS & COMPANY RESEARCH

STX earnings, valuation & price action

View in calendar ↗
NEXT EXPECTED REPORTJan 27 2027Time unconfirmed · ET
EPS ESTIMATE9.27
REVENUE ESTIMATE4.82B

Expected dates may change. Estimates use the source’s reporting currency. Quotes and research are snapshots, not live prices.

Loading STX earnings research…

STX earnings previews and market catalysts

October 27, 2026 earnings: payments, storage and cash flow tests after close
2026-10-27 · Visa, Seagate, Robinhood and NXP report after close on October 27. Watch payment activity, storage demand and the cash behind growth, alongside results from WM, ONEOK, Baker Hughes and Teradyne.

All upcoming earnings catalysts →

02 / FINANCIALS

Seagate Technologys financials

Revenue, earnings, cash flow and financial strength in one view.

Reporting currency unconfirmed.

Revenue
Net income
Gross profit
Operating income
EBITDA
Operating cash flow
Capital expenditure
Cash
Total assets
Total liabilities
Shareholder equity
Total debt
Net profit margin
Gross margin
Short interest: days to cover
How to read these financial metrics

Figures use the app’s saved statements for the displayed period, not a trailing-year total. Margins divide profit by revenue; quick ratio uses current assets less inventory divided by current liabilities. Compare dates and currencies before comparing companies.

03 / WHAT COMES NEXT

Seagate Technologys event catalysts

Company earnings and scheduled market events that may change expectations.

2027-01-27

STX earnings

Watch reported results, management’s outlook and the share-price reaction.

See earnings expectations ↑
2026-11-16Filing deadline · ET date

13F filing deadline · Q3 holdings

Filings may arrive earlier and positions can have changed. A filing is not a new trade or a guarantee of buying pressure.

Release schedule ↗Scheduled
2026-11-178:30 AM ET

Retail sales

Look beyond autos and gasoline; stronger spending can help earnings but also keep yields elevated.

Release schedule ↗Scheduled
2026-11-179:15 AM ET

Industrial production

Check factory output and utilization for changes in cyclical demand.

Release schedule ↗Scheduled
2026-11-188:30 AM ET

Housing starts & building permits

Housing is sensitive to interest rates. Watch permits for indications of future building activity.

Release schedule ↗Scheduled
2026-11-182:00 PM ET · expected

FOMC minutes

Methodology-based date; confirm the Fed calendar closer to release.

Release schedule ↗Rule-based date
2026-11-198:30 AM ET

Initial jobless claims

Use the multiweek trend to distinguish normal volatility from a sustained increase in layoffs.

Release schedule ↗Scheduled
2026-11-2010:00 AM ET

Consumer sentiment · final

Watch changes in inflation expectations as well as sentiment.

Release schedule ↗Scheduled
2026-11-20Contract-specific cutoff

Monthly options expiration

Check your contract. Position unwinds and hedging can affect trading volume.

Release schedule ↗Scheduled

Dates use U.S. Eastern time and can change. Calendar events provide context; they do not determine the direction of a stock move.

04 / SIDE BY SIDE

Compare STX with its peers

Industry · Compare valuation, financial strength and price performance.

Companies with valuation data0
Peer median positive P/E
STX P/E
STX peer comparison: valuation
CompanyPriceMarket capP/EForward P/EP/SForward P/S
STXSeagate Technologys

The peer median excludes the selected stock and is based on 0 available positive multiples. P/E median excludes negative or missing earnings multiples. Peer reports can have different fiscal periods and currencies; values are not currency-converted.

05 / PEER ANALYSIS

Explore STX alongside its peers

Computer Hardware · 14 companies · Cached market data

Comparison

Compare companies

Tap a bubble to inspect a company, then × to hide it. Undo restores the last company hidden. Bubble area reflects market cap, with a minimum size for visibility.

Price / sales
0.0×268.36M6.7×86.39B13.4×172.52B20.1×258.65BDELL · Dell Technologies Market cap: 233.64B Price / sales: 1.5×ANET · Arista Networks Market cap: 214.29B Price / sales: 18.0×SNDK · Sandisk Market cap: 155.38B Price / sales: 5.4×HPQ · HP Market cap: 25.27B Price / sales: 0.4×Market cap
STXSeagate Technologys

Market cap: 188.03B
Price / sales:

Valuation snapshot: See app
4 of 14 companies have both plotted values.

P/S distribution

Trailing price-to-sales multiples · 4 companies

Median P/S3.5×
Middle 50%1.3× to 8.5×
STX P/S
0.4×18.9×

Tap a bar to see the companies in that P/S range.

10 companies excluded from P/S statistics because sales are non-positive or the saved multiple is missing. Statistics include all valid positive values, including those outside the focused chart range.

Companies

Showing 8 of 14 matching companies · Largest market cap first

  • Market cap 233.64BP/E 21.0×P/S 1.5×Forward P/E Forward P/S Price snapshot: 2026-11-12
    ↗
  • Market cap 214.29BP/E 45.1×P/S 18.0×Forward P/E Forward P/S Price snapshot: 2026-11-12
    ↗
  • Market cap 188.03BP/E P/S Forward P/E Forward P/S Catalog snapshot
    ↗
  • Market cap 181.72BP/E P/S Forward P/E Forward P/S Catalog snapshot
    ↗
  • Market cap 155.38BP/E 8.1×P/S 5.4×Forward P/E Forward P/S Price snapshot: 2026-11-12
    ↗
  • Market cap 25.27BP/E 10.6×P/S 0.4×Forward P/E Forward P/S Price snapshot: 2026-11-11
    ↗
  • Market cap 18.53BP/E P/S Forward P/E Forward P/S Catalog snapshot
    ↗
  • Market cap 15.05BP/E P/S Forward P/E Forward P/S Catalog snapshot
    ↗

Explore industries

Open an industry for its comparison, valuation and companies.

U.S.-listed companies from the app’s catalog. Medians use saved positive P/E values; coverage and snapshot dates vary.

How this comparison works

Uses the saved companies from the same industry and listing market, including STX, ordered by cached market cap. Company snapshots can have different dates; the web cache may cover fewer metrics and periods than the app.

Periods end at each company’s dated price snapshot. Change compares the latest saved observation with one at or before the selected period’s start. A daily price change uses consecutive saved sessions. Financial data updates quarterly, so short periods may show no change. Missing history and zero starting values are excluded; a negative starting value uses its absolute value as the denominator.

Metrics use saved ratios and percentages. Market caps use the listing market’s reporting currency; underlying financial statements may use different currencies. Circle sizes have a minimum for touch visibility, and an outlined circle indicates a missing market cap. These comparisons describe data, not recommendations or price predictions.

INDUSTRY COMPARISON

STX industry peers

Computer Hardware · Oct 16, 2026 · Closing-price performance

Compare STX with 4 other stocks in the available heatmap coverage.