
Share Quanta’s record backlog faces a new test from data-center policy risk
← Stock movers news
Market movers
Quanta Services, Inc.PWR · Engineering & Construction
PWR · November 4, 2026During trading · Since the previous regular close
-14.04%Session snapshot

Quanta’s record backlog faces a new test from data-center policy risk
40
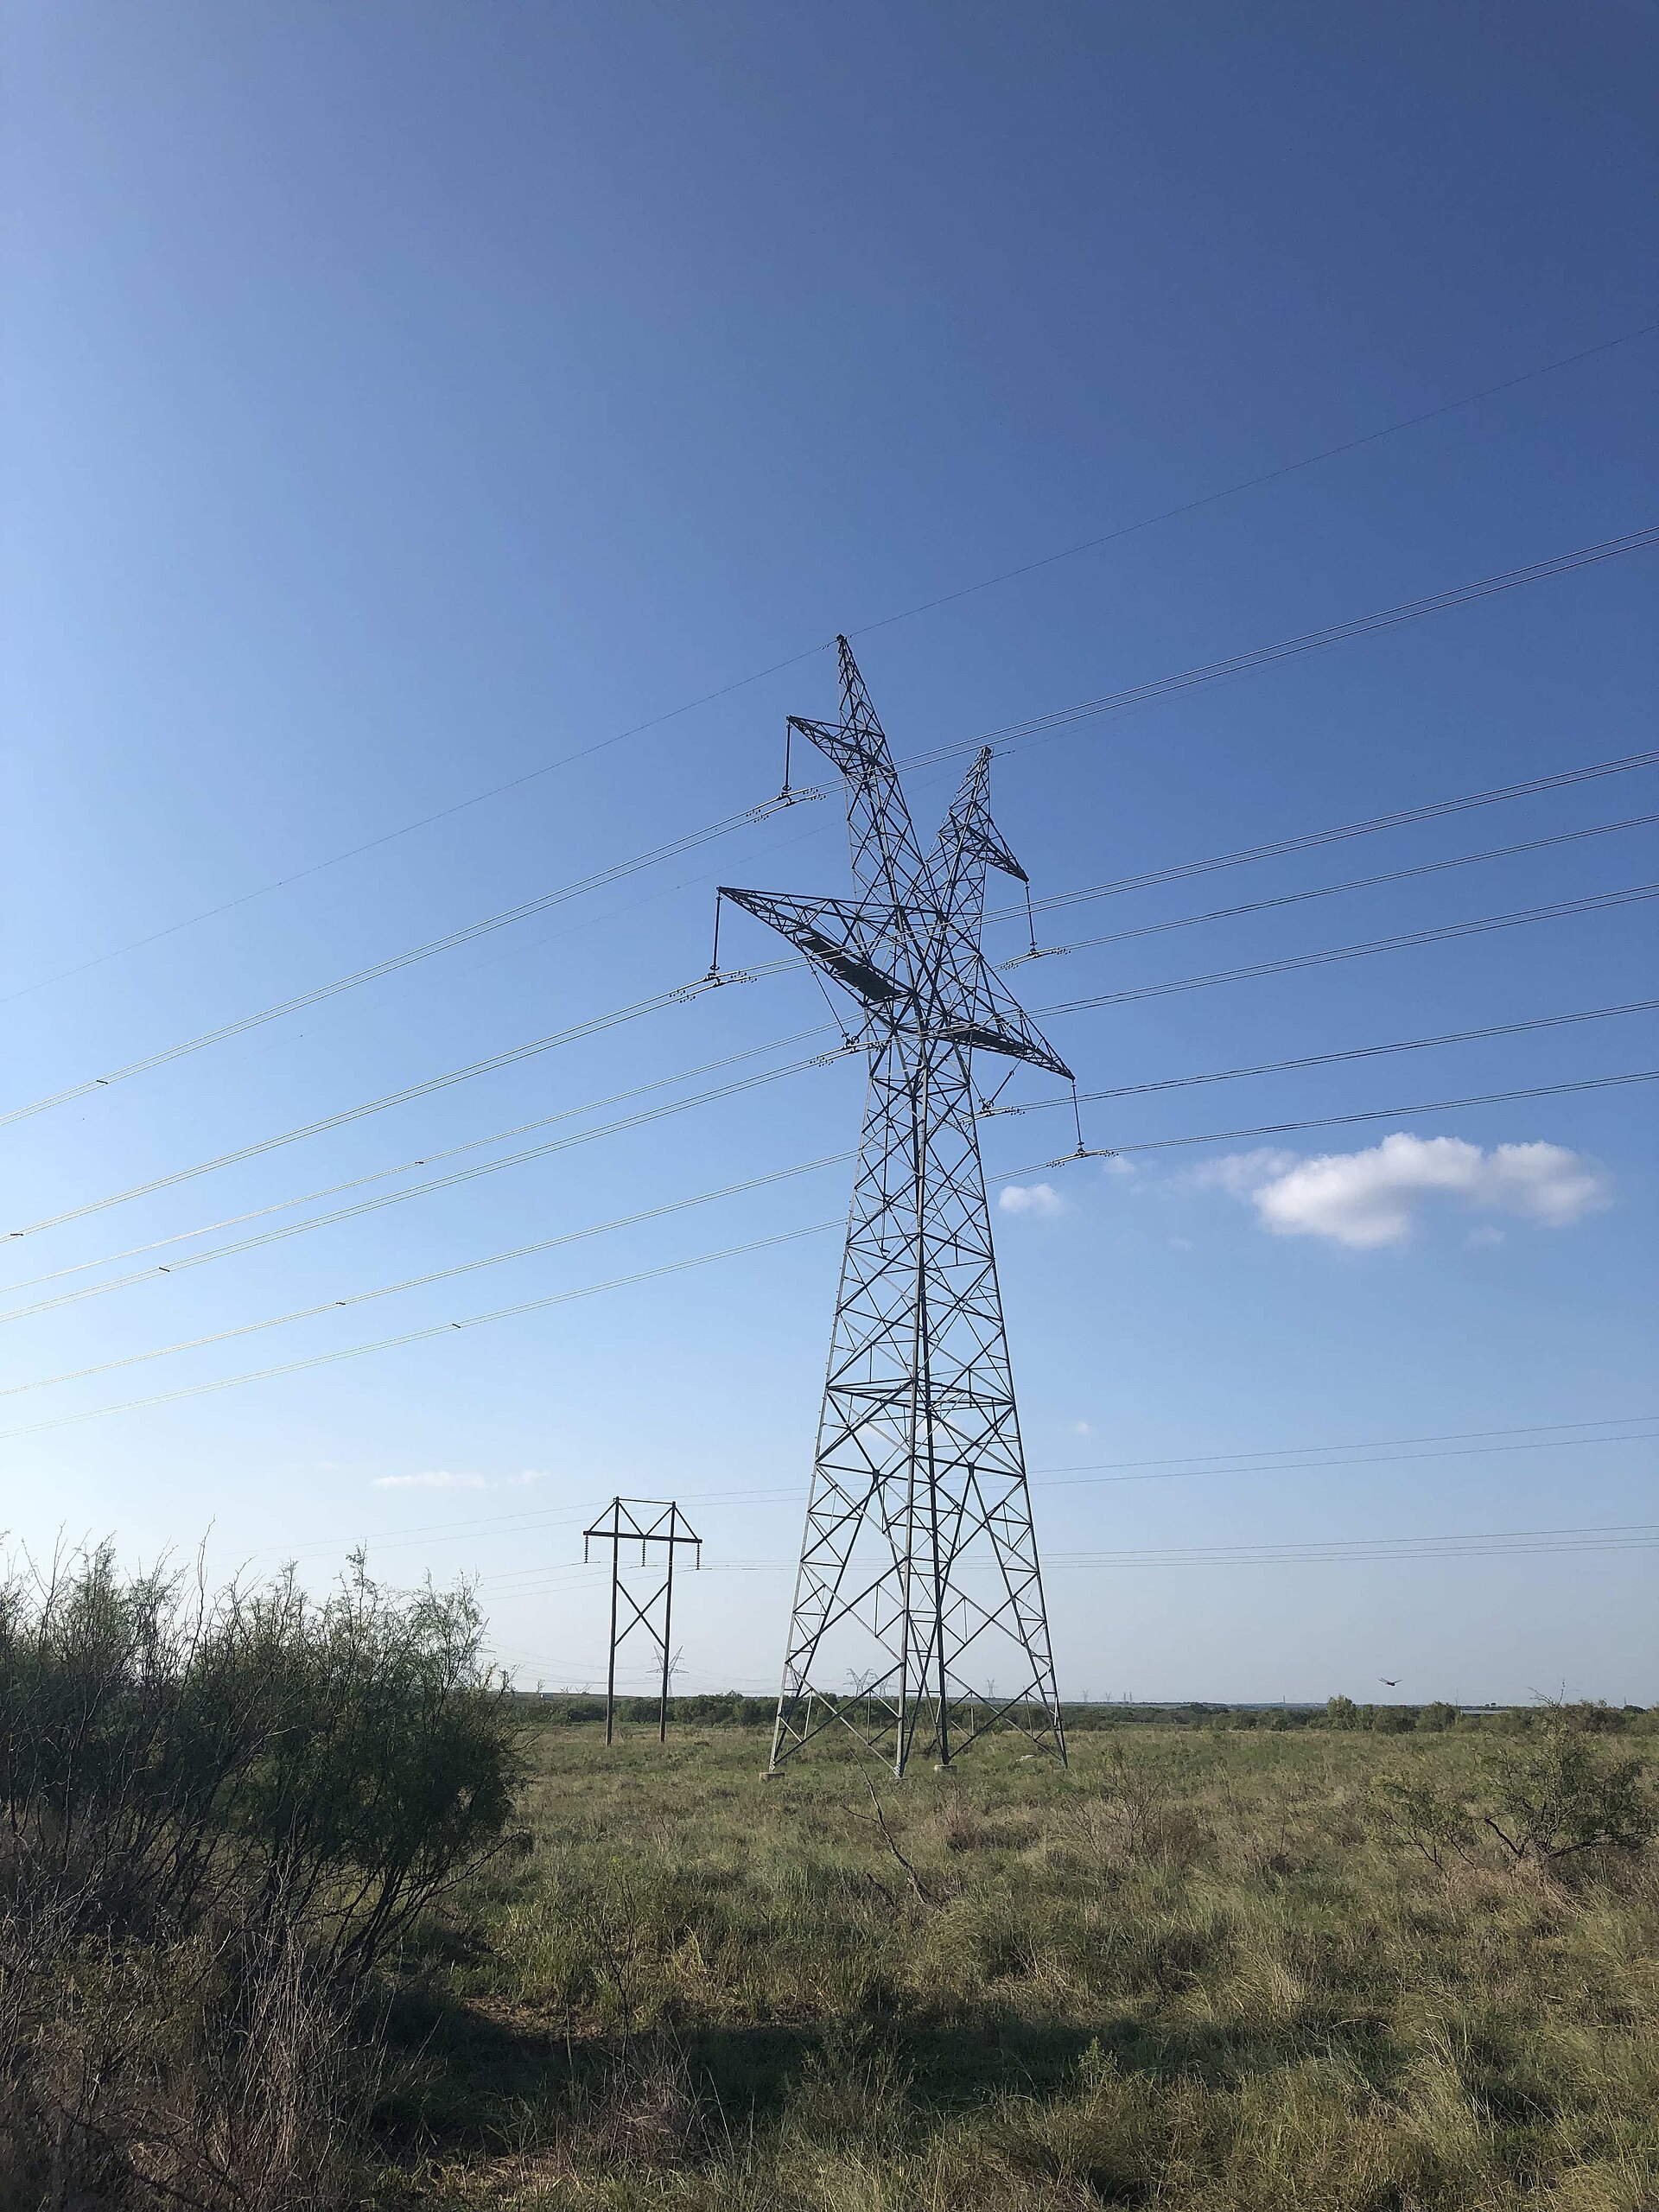
Power transmission towers crossing rural land in Texas
Transmission lines in Clay County, Texas, photographed in September 2019. Illustrative archive image; this is not identified as a Quanta project. Photo: Jphill19 / Wikimedia Commons · CC BY-SA 4.0 · Wikimedia-supplied thumbnail; displayed with a responsive crop.
THE CATALYST

What is behind the stock move?

The November 4 election outcome brought fresh scrutiny to data-center approvals and AI infrastructure spending. Quanta builds electrical and other critical infrastructure, so slower project approvals could delay future awards and work. Its September backlog provides substantial visibility, while its utility and underground businesses add other sources of demand. The next investor test is whether customer budgets and construction schedules hold up as the new political priorities take shape.

AT A GLANCE

Latest company research

Post-election scrutiny of data-center construction puts Quanta’s future project growth in focus. The price used for this comparison fell about 14% versus the previous close during trading on November 4.

  • Democratic election gains increased concerns about tougher oversight and slower data-center approvals. For a contractor that builds electrical infrastructure, project timing matters because delays can push future work and cash receipts further out.
  • Quanta also serves utility grid upgrades, power generation and underground infrastructure. This broader customer base gives investors more to assess than the outlook for data centers alone.
  • The company reported $63.7 billion of backlog, its estimate of future work, as of September 30. That figure includes work under service agreements and estimated renewals, so it is broader than firmly committed orders.
  • Remaining performance obligations were $41.8 billion at the same date. This narrower accounting measure covers contracted work still to be delivered and offers another way to judge revenue visibility.
  • Before the election, Bernstein favored Quanta within machinery and electrical stocks. Its view was that jobs and tax revenue could encourage officials to permit projects while making developers pay more infrastructure costs; that remains an analyst judgment.
  • Quanta’s latest earnings update came on October 29. The next useful signals are contract awards, backlog conversion and any customer comments about changes to construction schedules.

Watch actual permitting decisions and project spending. Delays, labor shortages, cost overruns and acquisition integration could pressure margins; the charts show November 3, before the latest trading-day decline.

THE VISUAL RESEARCH

Financials and technicals

Charts through Nov 3, 2026. The session move above may reflect later news.

Financials
Technicals
WHAT TO WATCH

Technical setup and risks

At the completed November 3 close of $657, shares were above the 20-day average near $630.44 and 50-day near $633.29; RSI was about 56.5. Prior support at $607.2–620.00 reflects October 28–30 and November 2 lows. Resistance at $649–657.20 reflects October 29 and November 3 highs. The November 4 decline is below that old support. Reclaiming the band would aid stabilization; sustained weakness below it leaves the recent rebound vulnerable. These are approximate historical zones.

AI-assisted research with source and calculation checks. Prices may be delayed. Technical charts use the stated completed session, which can precede the quoted intraday move. Educational information; investing involves risk.

EXPLORE COMPANY RESEARCH

Quanta Services: the full stock picture

Earnings history, financials, price action and peer comparisons — all below.
Open PWR stock page ↗

EXPLORE THE COMPANY

Quanta Services (PWR)

Explore earnings, price action, financials and industry comparisons.

Symbol
PWR
Sector
Industrials
Industry
Engineering & Construction
Instrument type
EQUITY

Profile information from our saved company catalog. This is not a live quote or confirmation of current listing status.

EARNINGS & COMPANY RESEARCH

PWR earnings, valuation & price action

View in calendar ↗

No upcoming report date is available in the current calendar window.

Expected dates may change. Estimates use the source’s reporting currency. Quotes and research are snapshots, not live prices.

Loading PWR earnings research…
02 / FINANCIALS

Quanta Services financials

Revenue, earnings, cash flow and financial strength in one view.

Reporting currency unconfirmed.

Revenue
Net income
Gross profit
Operating income
EBITDA
Operating cash flow
Capital expenditure
Cash
Total assets
Total liabilities
Shareholder equity
Total debt
Net profit margin
Gross margin
Short interest: days to cover
How to read these financial metrics

Figures use the app’s saved statements for the displayed period, not a trailing-year total. Margins divide profit by revenue; quick ratio uses current assets less inventory divided by current liabilities. Compare dates and currencies before comparing companies.

03 / WHAT COMES NEXT

Quanta Services event catalysts

Company earnings and scheduled market events that may change expectations.

2026-11-0410:00 AM ET

ISM services PMI

Services prices and employment can influence the outlook for inflation and rates.

Release schedule ↗Scheduled
2026-11-058:30 AM ET

Initial jobless claims

Use the multiweek trend to distinguish normal volatility from a sustained increase in layoffs.

Release schedule ↗Scheduled
2026-11-068:30 AM ET

Jobs report · payrolls & unemployment

Read revisions and wages alongside the headline. Strong hiring can support demand but also lift rate expectations.

Release schedule ↗Scheduled
2026-11-0610:00 AM ET

Consumer sentiment · preliminary

Watch changes in inflation expectations as well as sentiment.

Release schedule ↗Scheduled
2026-11-108:30 AM ET

CPI inflation

Compare headline and core inflation with expectations; watch Treasury yields and growth stocks.

Release schedule ↗Scheduled
2026-11-11Time not announced

MSCI · index review announcement

Review official additions, deletions and weight changes; release time is not specified here.

Release schedule ↗Scheduled
2026-11-128:30 AM ET

Initial jobless claims

Use the multiweek trend to distinguish normal volatility from a sustained increase in layoffs.

Release schedule ↗Scheduled
2026-11-138:30 AM ET

PPI inflation

Watch the surprise versus expectations and implications for margins and interest rates.

Release schedule ↗Scheduled

Dates use U.S. Eastern time and can change. Calendar events provide context; they do not determine the direction of a stock move.

04 / SIDE BY SIDE

Compare PWR with its peers

Industry · Compare valuation, financial strength and price performance.

Companies with valuation data0
Peer median positive P/E
PWR P/E
PWR peer comparison: valuation
CompanyPriceMarket capP/EForward P/EP/SForward P/S
PWRQuanta Services

The peer median excludes the selected stock and is based on 0 available positive multiples. P/E median excludes negative or missing earnings multiples. Peer reports can have different fiscal periods and currencies; values are not currency-converted.

05 / PEER ANALYSIS

Explore PWR alongside its peers

Engineering & Construction · 7 companies · Cached market data

Comparison

Compare companies

Tap a bubble to inspect a company, then × to hide it. Undo restores the last company hidden. Bubble area reflects market cap, with a minimum size for visibility.

Price / sales

Explore this comparison with the full research in the app.

PWRQuanta Services

Market cap: 102.27B
Price / sales:

Valuation snapshot: See app
0 of 7 companies have both plotted values.

P/S distribution

Trailing price-to-sales multiples · 0 companies

Median P/S
Middle 50%
PWR P/S

No positive P/S values available for this group.

7 companies excluded from P/S statistics because sales are non-positive or the saved multiple is missing. Statistics include all valid positive values, including those outside the focused chart range.

Companies

Showing 7 of 7 matching companies · Largest market cap first

  • Market cap 102.27BP/E P/S Forward P/E Forward P/S Catalog snapshot
    ↗
  • Market cap 20.96BP/E P/S Forward P/E Forward P/S Catalog snapshot
    ↗
  • Market cap 17.22BP/E P/S Forward P/E Forward P/S Catalog snapshot
    ↗
  • Market cap 16.38BP/E P/S Forward P/E Forward P/S Catalog snapshot
    ↗
  • Market cap 8.66BP/E P/S Forward P/E Forward P/S Catalog snapshot
    ↗
  • Market cap 7.01BP/E P/S Forward P/E Forward P/S Catalog snapshot
    ↗
  • Market cap 3.31BP/E P/S Forward P/E Forward P/S Catalog snapshot
    ↗

Explore industries

Open an industry for its comparison, valuation and companies.

U.S.-listed companies from the app’s catalog. Medians use saved positive P/E values; coverage and snapshot dates vary.

How this comparison works

Uses the saved companies from the same industry and listing market, including PWR, ordered by cached market cap. Company snapshots can have different dates; the web cache may cover fewer metrics and periods than the app.

Periods end at each company’s dated price snapshot. Change compares the latest saved observation with one at or before the selected period’s start. A daily price change uses consecutive saved sessions. Financial data updates quarterly, so short periods may show no change. Missing history and zero starting values are excluded; a negative starting value uses its absolute value as the denominator.

Metrics use saved ratios and percentages. Market caps use the listing market’s reporting currency; underlying financial statements may use different currencies. Circle sizes have a minimum for touch visibility, and an outlined circle indicates a missing market cap. These comparisons describe data, not recommendations or price predictions.

INDUSTRY COMPARISON

PWR industry peers

Engineering & Construction · Oct 16, 2026 · Closing-price performance

No industry peers are available in the current heatmap coverage.