
Share Microchip falls after earnings as it forecasts lower margins
← Stock movers news
Earnings results
Microchip TechnologyMCHP · Semiconductors
MCHP · November 6, 2026During trading · Since the previous regular close
-11.06%Session snapshot

Microchip falls after earnings as it forecasts lower margins

Earnings results

  • EPS beat by 3.2%

    Adjusted profit per share was $0.97 versus $0.94 expected.

  • Revenue

    $1.62 billion, up 42% from a year earlier.

  • Guidance

    Adjusted gross margin of 64% to 65%, down from 66.5% last quarter.
30
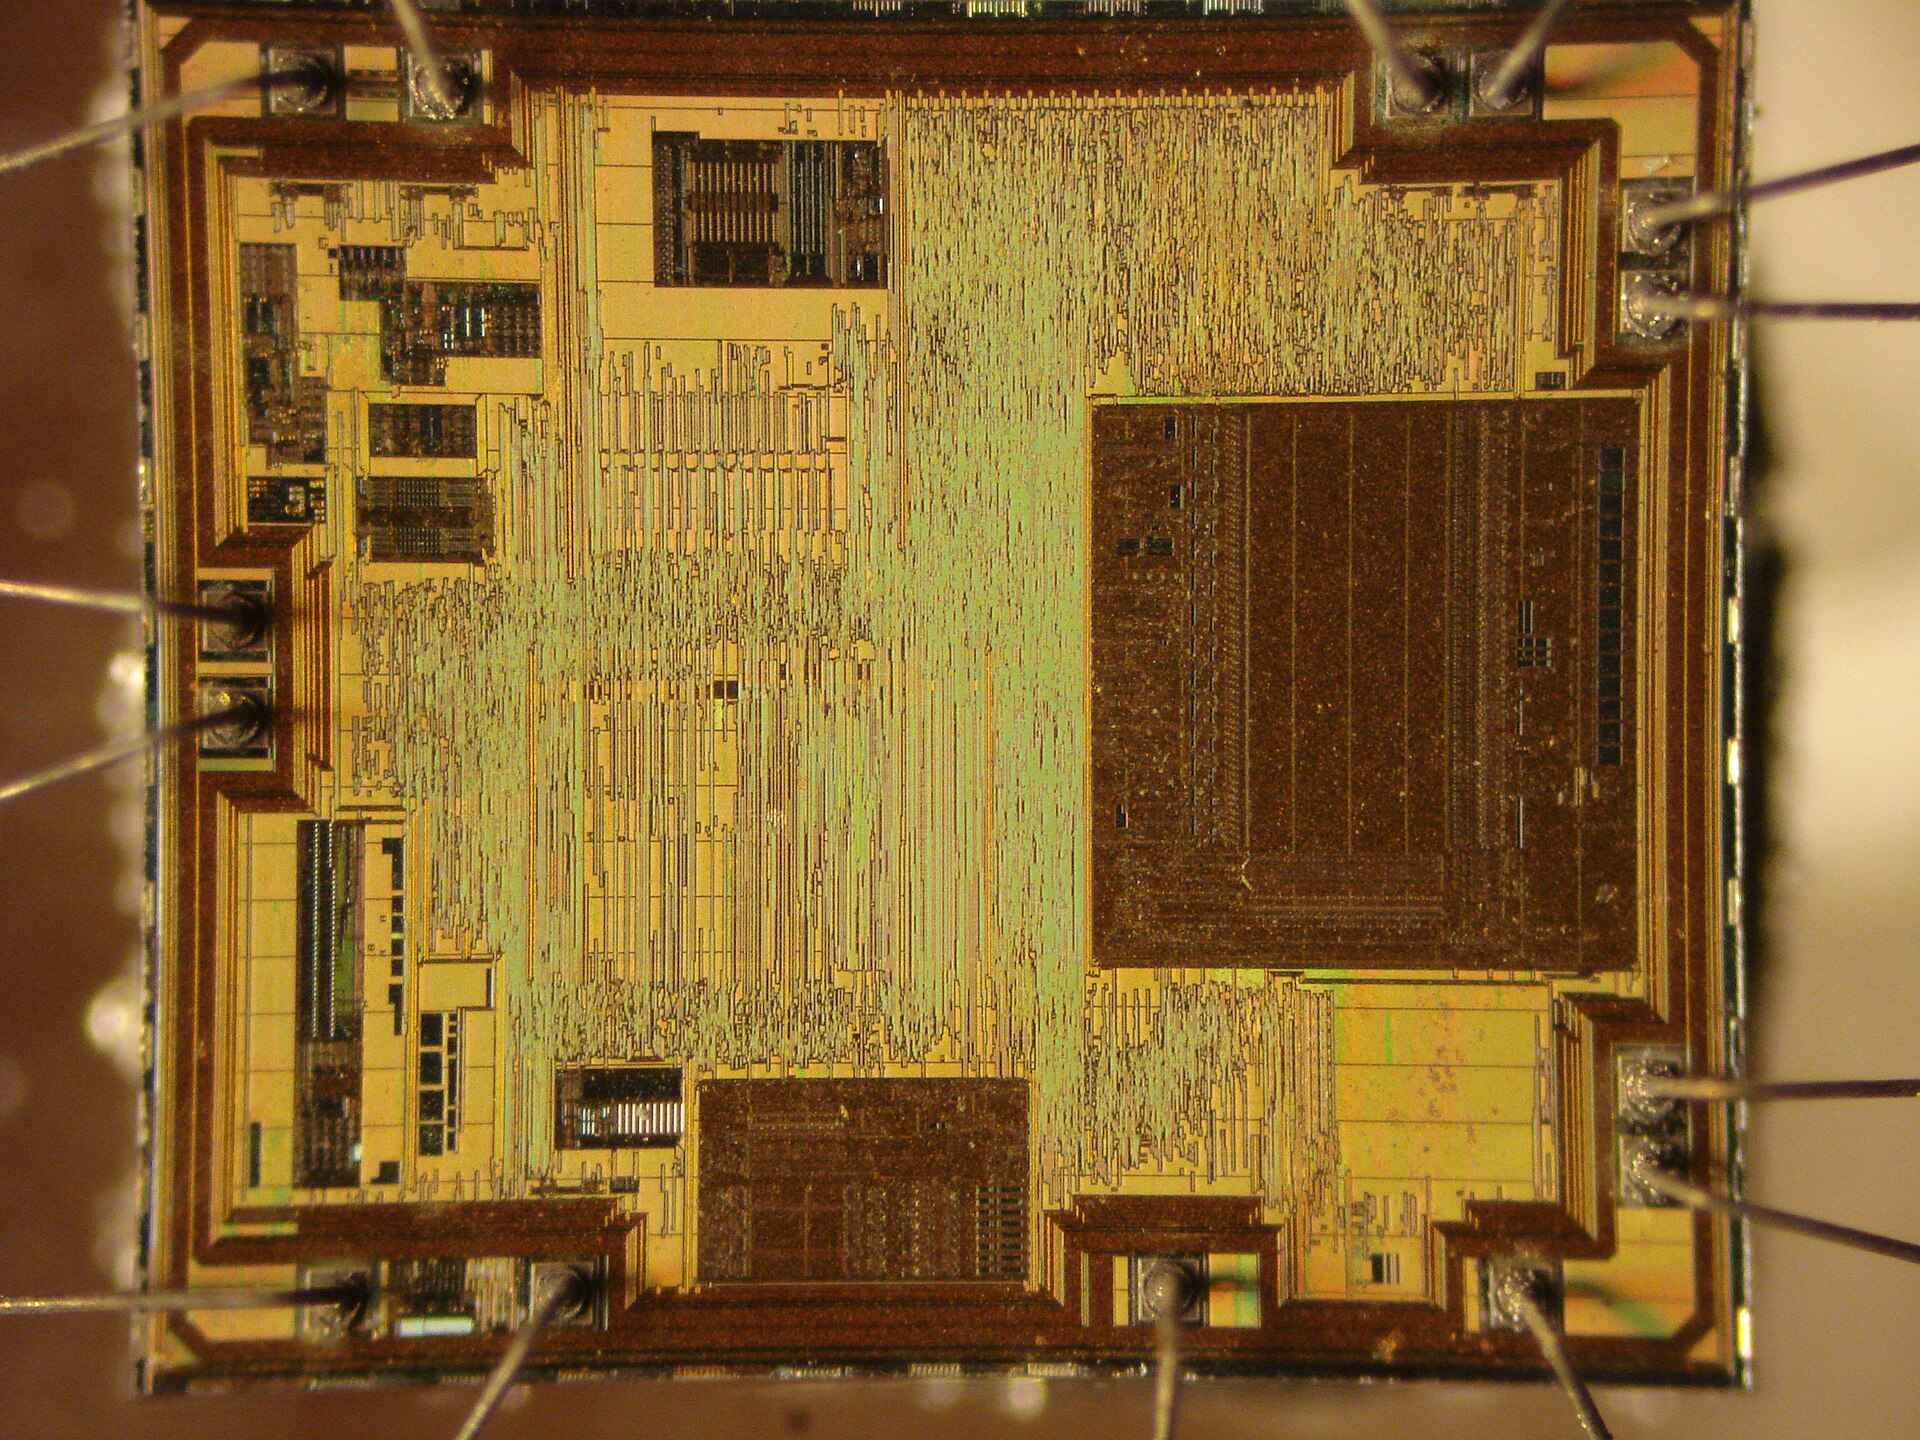
Close-up of a Microchip PIC16F684 microcontroller
Archive photo of a Microchip PIC16F684 microcontroller, July 2013. Photo: Epop / Wikimedia Commons · CC BY-SA 3.0 · Wikimedia-supplied thumbnail; displayed with a responsive crop.
THE CATALYST

Earnings and the stock move

Microchip fell after projecting a December-quarter adjusted gross margin of 64% to 65%, below the September quarter’s 66.5%. September sales cleared the company’s forecast, but $53 million came from items management says will not recur. Management also flagged longer supply lead times.

AT A GLANCE

Q2 FY2027 earnings recap

Microchip Technology fell about 11% during trading on November 6, 2026, after its earnings report pointed to a lower share of sales left after production costs.

  • Sales reached $1.62 billion in the September quarter, up 42% from a year earlier and above the high end of management’s forecast.
  • Adjusted earnings per share, or profit per share, were $0.97 versus $0.94 expected. Reported profit was $0.68 per share.
  • Microchip expects December-quarter sales of $1.57 billion to $1.64 billion. The midpoint is about 1% below the September quarter.
  • About $53 million in September sales came from items the company says will not repeat in December.
  • Management said it is taking longer to get supplies and is working to secure more silicon wafers. That matters because it can limit how quickly orders turn into shipments.
  • Microchip doubled its tally of designs that use its latest data-center switches and signal boosters from 12 at the end of June to 24 by the report date.

Watch whether Microchip can ship more chips and restore margins as it adds capacity.

THE VISUAL RESEARCH

Financials and technicals

Charts through Nov 5, 2026. The session move above may reflect later news.

Financials
Technicals
WHAT TO WATCH

Technical setup and risks

Thursday closed near $65 before earnings. A return to the $74–75 area would recover much of Thursday’s drop. A close below Thursday’s $64 low would leave the stock below that session’s range.

AI-assisted research with source and calculation checks. Prices may be delayed. Technical charts use the stated completed session, which can precede the quoted intraday move. Educational information; investing involves risk.

EXPLORE COMPANY RESEARCH

Microchip Technologyorporat: the full stock picture

Earnings history, financials, price action and peer comparisons — all below.
Open MCHP stock page ↗

EXPLORE THE COMPANY

Microchip Technologyorporat (MCHP)

Explore earnings, price action, financials and industry comparisons.

Symbol
MCHP
Sector
Technology
Industry
Semiconductors
Instrument type
EQUITY

Profile information from our saved company catalog. This is not a live quote or confirmation of current listing status.

EARNINGS & COMPANY RESEARCH

MCHP earnings, valuation & price action

View in calendar ↗
NEXT EXPECTED REPORTFeb 4 2027Time unconfirmed · ET
EPS ESTIMATE0.96
REVENUE ESTIMATE1.63B

Expected dates may change. Estimates use the source’s reporting currency. Quotes and research are snapshots, not live prices.

COMPANY RESEARCH · Technology

Microchip Technology Incorporated MCHP

Semiconductors · Updated 11/6/2026

Adjusted closing price · USD64.85 Nov 5
476685104Nov 4May 7Nov 5
Price50-day average200-day average+11.8% in view
VALUATION & EXPECTATIONS
Trailing P/E100.6×
Forward P/E17.8×
Trailing P/S6.3×
Forward P/S5.5×
EPS beat rate88%
Revenue beat rate88%
Positive window29%

EPS beats: 7 of 8 comparable reports. Positive price windows: 2 of 7.

Market caps may be up to 14 days old; prices up to seven days old; ratios and analyst estimates up to fourteen days old. Forward multiples use consensus for the fiscal year ending 2027-03-31, not the next 12 months. Negative or unavailable earnings multiples show “N/A”. Forward ADR multiples are omitted when the currency/share basis is not reconciled.

50-day average75.19
200-day average79.12
RSI (14)33
20-day range71.25 – 81.12
Relative volume3.8×
1-year change+11.8%
Last eight reported earnings for MCHP
Report dateEPS estimateEPS actualSurpriseResultRevenue actualPrice window*5 sessions*
Nov 5 20260.940.97+3.6%Beat1.62BN/AN/A
Aug 6 20260.700.76+8.6%Beat1.48B+8.9%-0.1%
May 7 20260.510.57+12.9%Beat1.31B-3.7%-5.7%
Feb 5 20260.430.44+2.7%Beat1.19B-2.8%+0.9%
Nov 6 20250.330.35+5.9%Beat1.14B-7.4%-9.9%
Aug 7 20250.240.27+13.0%Beat1.08B-6.5%-0.3%
May 8 20250.100.11+5.1%Beat970.5M+15.1%+26.5%
Feb 6 20250.280.20-27.9%Miss1.03B-3.0%+1.4%

*Adjusted close before the report date to the first (or fifth) trading close after it. This window can span two sessions and is not an isolated earnings-day return. Figures may be revised by the provider.

Smart Money activity

Recent insider and politician transactions, and disclosed fund positions for MCHP.

Get Pro to see what insiders are doing ahead of earnings.

Explore insider trades, fund holdings and politician activity with an active Pro membership.

Checking membership…

02 / FINANCIALS

Microchip Technologyorporat financials

Revenue, earnings, cash flow and financial strength in one view.

Reporting currency unconfirmed.

Revenue
Net income
Gross profit
Operating income
EBITDA
Operating cash flow
Capital expenditure
Cash
Total assets
Total liabilities
Shareholder equity
Total debt
Net profit margin
Gross margin
Short interest: days to cover
How to read these financial metrics

Figures use the app’s saved statements for the displayed period, not a trailing-year total. Margins divide profit by revenue; quick ratio uses current assets less inventory divided by current liabilities. Compare dates and currencies before comparing companies.

03 / WHAT COMES NEXT

Microchip Technologyorporat event catalysts

Company earnings and scheduled market events that may change expectations.

2027-02-04

MCHP earnings

Watch reported results, management’s outlook and the share-price reaction.

See earnings expectations ↑
2026-11-068:30 AM ET

Jobs report · payrolls & unemployment

Read revisions and wages alongside the headline. Strong hiring can support demand but also lift rate expectations.

Release schedule ↗Scheduled
2026-11-0610:00 AM ET

Consumer sentiment · preliminary

Watch changes in inflation expectations as well as sentiment.

Release schedule ↗Scheduled
2026-11-108:30 AM ET

CPI inflation

Compare headline and core inflation with expectations; watch Treasury yields and growth stocks.

Release schedule ↗Scheduled
2026-11-11Time not announced

MSCI · index review announcement

Review official additions, deletions and weight changes; release time is not specified here.

Release schedule ↗Scheduled
2026-11-128:30 AM ET

Initial jobless claims

Use the multiweek trend to distinguish normal volatility from a sustained increase in layoffs.

Release schedule ↗Scheduled
2026-11-138:30 AM ET

PPI inflation

Watch the surprise versus expectations and implications for margins and interest rates.

Release schedule ↗Scheduled
2026-11-13Time not announced

Russell · preliminary additions/deletions

Check the official lists. Preliminary changes can be revised.

Release schedule ↗Scheduled
2026-11-16Filing deadline · ET date

13F filing deadline · Q3 holdings

Filings may arrive earlier and positions can have changed. A filing is not a new trade or a guarantee of buying pressure.

Release schedule ↗Scheduled

Dates use U.S. Eastern time and can change. Calendar events provide context; they do not determine the direction of a stock move.

04 / SIDE BY SIDE

Compare MCHP with its peers

Semiconductors · Compare valuation, financial strength and price performance.

Companies with valuation data6
Peer median positive P/E48.0×
MCHP P/E100.6×
MCHP peer comparison: valuation
CompanyPriceMarket capP/EForward P/EP/SForward P/S
MCHPMicrochip Technologyorporat2026-11-05 · USD64.8535.21B100.6×17.8×6.3×5.5×
ADIAnalog Devices, Inc.2026-11-05 · USD361.01196.85B48.0×21.5×14.2×10.6×
LSCCLattice Semiconductor Corporation2026-11-05 · USD98.0313.92B302.5×45.9×17.2×15.1×
MPWRMonolithic Power Systems, Inc.2026-11-05 · USD1,131.4355.2B62.1×38.8×14.8×12.7×
NXPINXP Semiconductors N.V.2026-11-05 · USD244.4364.82B20.1×16.1×4.7×4.5×
ONON Semiconductor Corporation2026-11-05 · USD63.0124.53B35.8×19.2×3.9×3.7×
RNECYRenesas Electronics Corporation
MCHP100.6×
ADI48.0×
LSCC302.5×
MPWR62.1×
NXPI20.1×
ON35.8×

The peer median excludes the selected stock and is based on 5 available positive multiples. P/E median excludes negative or missing earnings multiples. Peer reports can have different fiscal periods and currencies; values are not currency-converted.

05 / PEER ANALYSIS

Explore MCHP alongside its peers

Semiconductors · 31 companies · Cached market data

Comparison

Compare companies

Tap a bubble to inspect a company, then × to hide it. Undo restores the last company hidden. Bubble area reflects market cap, with a minimum size for visibility.

Price / sales
0.0×012.9×1.94T25.8×3.89T38.7×5.83TNVDA · NVIDIA Market cap: 5.21T Price / sales: 17.2×TSM · Taiwan Semiconductor Manufactur Market cap: 2.27T Price / sales: 12.7×AVGO · Broadcom Market cap: 1.64T Price / sales: 18.4×MU · Micron Technology Market cap: 1.02T Price / sales: 7.7×AMD · Advanced Micro Devices Market cap: 923B Price / sales: 22.3×INTC · Intel Market cap: 504.98B Price / sales: 8.9×TXN · Texas Instruments Market cap: 274.9B Price / sales: 13.2×ADI · Analog Devices Market cap: 196.85B Price / sales: 14.2×MRVL · Marvell Technology Market cap: 192.84B Price / sales: 20.4×ARM · Arms plc Market cap: 179.57B Price / sales: 34.8×QCOM · QUALCOMM Market cap: 170.95B Price / sales: 4.0×NXPI · NXP Semiconductors N.V. Market cap: 64.82B Price / sales: 4.7×MPWR · Monolithic Power Systems Market cap: 55.2B Price / sales: 14.8×ON · ON Semiconductor Market cap: 24.53B Price / sales: 3.9×MTSI · MACOM Technology Solutions Hold Market cap: 14.54B Price / sales: 10.9×LSCC · Lattice Semiconductor Corporati Market cap: 13.92B Price / sales: 17.2×CRUS · Cirrus Logic Market cap: 5.54B Price / sales: 2.7×ALGM · Allegro MicroSystems Market cap: 5B Price / sales: 5.0×DIOD · Diodes Market cap: 3.76B Price / sales: 2.3×MCHP · Microchip Technology Incorporated Market cap: 35.21B Price / sales: 6.3×Hide MCHP · Undo restores itMarket cap
MCHPMicrochip Technology Incorporated

Market cap: 35.21B
Price / sales: 6.3×

Valuation snapshot: 2026-11-05
20 of 31 companies have both plotted values.

P/S distribution

Trailing price-to-sales multiples · 20 companies

Median P/S11.8×
Middle 50%4.9× to 17.2×
MCHP P/S6.3×
MCHP
2.1×36.6×

Tap a bar to see the companies in that P/S range. MCHP has a higher P/S than 30% of this group.

11 companies excluded from P/S statistics because sales are non-positive or the saved multiple is missing. Statistics include all valid positive values, including those outside the focused chart range.

Companies

Showing 8 of 31 matching companies · Largest market cap first

  • Market cap 5.21TP/E 27.2×P/S 17.2×Forward P/E Forward P/S Price snapshot: 2026-11-05 · Financials: 2026-07-31
    ↗
  • Market cap 2.27TP/E 24.7×P/S 12.7×Forward P/E Forward P/S Price snapshot: 2026-11-05
    ↗
  • Market cap 1.64TP/E 42.5×P/S 18.4×Forward P/E Forward P/S Price snapshot: 2026-11-05 · Financials: 2026-08-02
    ↗
  • Market cap 1.02TP/E 12.0×P/S 7.7×Forward P/E Forward P/S Price snapshot: 2026-11-05
    ↗
  • Market cap 923BP/E 143.5×P/S 22.3×Forward P/E Forward P/S Price snapshot: 2026-11-05 · Financials: 2026-09-26
    ↗
  • Market cap 504.98BP/E P/S 8.9×Forward P/E Forward P/S Price snapshot: 2026-11-05 · Financials: 2026-09-26
    ↗
  • Market cap 274.9BP/E 38.9×P/S 13.2×Forward P/E Forward P/S Price snapshot: 2026-11-05
    ↗
  • Market cap 196.85BP/E 48.0×P/S 14.2×Forward P/E Forward P/S Price snapshot: 2026-11-05
    ↗

Explore industries

Open an industry for its comparison, valuation and companies.

U.S.-listed companies from the app’s catalog. Medians use saved positive P/E values; coverage and snapshot dates vary.

How this comparison works

Uses the saved companies from the same industry and listing market, including MCHP, ordered by cached market cap. Company snapshots can have different dates; the web cache may cover fewer metrics and periods than the app.

Periods end at each company’s dated price snapshot. Change compares the latest saved observation with one at or before the selected period’s start. A daily price change uses consecutive saved sessions. Financial data updates quarterly, so short periods may show no change. Missing history and zero starting values are excluded; a negative starting value uses its absolute value as the denominator.

Metrics use saved ratios and percentages. Market caps use the listing market’s reporting currency; underlying financial statements may use different currencies. Circle sizes have a minimum for touch visibility, and an outlined circle indicates a missing market cap. These comparisons describe data, not recommendations or price predictions.

INDUSTRY COMPARISON

MCHP industry peers

Semiconductors · Oct 16, 2026 · Closing-price performance

Compare MCHP with 12 other stocks in the available heatmap coverage.