Intel extends its earnings selloff as weak PC demand clouds the profit outlook
Earnings results
- EPS beat +33.3%
Actual: $0.52 · Cons.: $0.39 (non-GAAP diluted EPS attributable to Intel)
- Revenue beat +0.4%
Actual: $16.513B · Cons.: $16.44B (reported net revenue)
- Guidance
Issued Q4 revenue of $15–$16 billion and adjusted EPS of $0.25; below the October 29 consensus of $16.8 billion and $0.42.
Earnings and the stock move
Intel’s November 2 decline extends the selloff following its October 29 earnings release. The unresolved investment question is whether server demand can offset weaker PCs while Intel funds manufacturing capacity. The fourth-quarter sales and adjusted-profit outlook fell below the dated expectations published with the release. These are continuing concerns from last week’s report, not a new November 2 earnings announcement.
Q3 2026 ended September 26 earnings recap
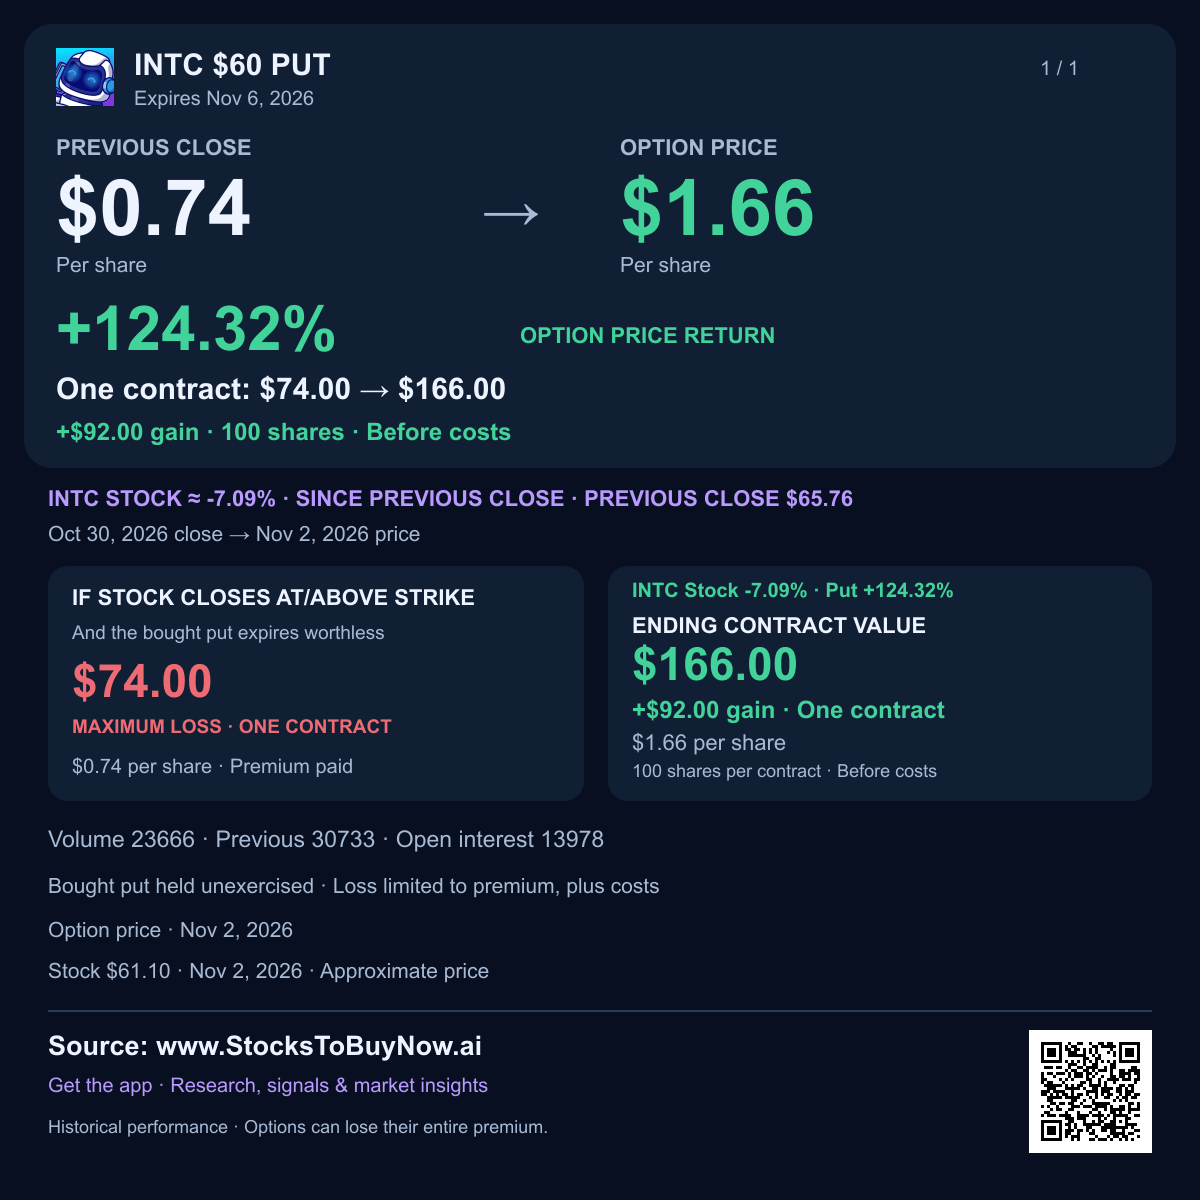
Intel fell another 8.4% during trading on November 2, 2026, extending its earnings selloff. Its October 29 outlook put weak PC demand and lower near-term profitability in focus.
- The fourth-quarter forecast calls for $15–$16 billion in revenue and adjusted EPS, or profit per share, of $0.25. Both trail the expectations published with the October 29 earnings report.
- Intel’s completed third quarter was stronger: revenue reached $16.51 billion and adjusted EPS was $0.52. Better past results have not removed concern about the next quarter.
- Management expects the PC slowdown to continue through at least the first half of 2027. That puts pressure on a major source of Intel’s sales.
- Data Center and AI revenue rose 78% from a year earlier to $7.3 billion in the third quarter. The opportunity depends partly on producing enough processors to meet demand.
- The adjusted gross-margin outlook is 38%, versus 44.1% in the third quarter. Gross margin is the share of sales left after production costs, before other expenses.
- The October 30 completed-session chart shows a 28.6% decline on heavy trading volume. November 2 trading has since moved below that session’s low, keeping the near-term setup weak.
Watch server shipments, PC demand and manufacturing costs for evidence that the outlook is stabilizing. A large share-price decline alone does not make a recovery certain.
Financials and technicals
Charts through Oct 30, 2026. The session move above may reflect later news.
Technical setup and risks
October 30 closed at $65.76 after trading between $63.2 and $68.77. November 2 trading is below that completed-session range. Recovering $63.2 and then roughly $68.8 would improve the setup; remaining below the old low leaves downside risk. Watch closing price and volume, and treat these areas as reference levels rather than guaranteed turning points.
AI-assisted research with source and calculation checks. Prices may be delayed. Technical charts use the stated completed session, which can precede the quoted intraday move. Educational information; investing involves risk.