
Garmin falls despite record profit and a higher full-year outlook
Earnings results
- EPS
Pro forma profit per share: $2.76; GAAP: $2.80.
- Revenue
$1.986 billion, up 12% from a year earlier.
- Guidance
Raised FY2026 pro forma EPS to $10.80 from $10.00; revenue to $8.15B from $8.05B.
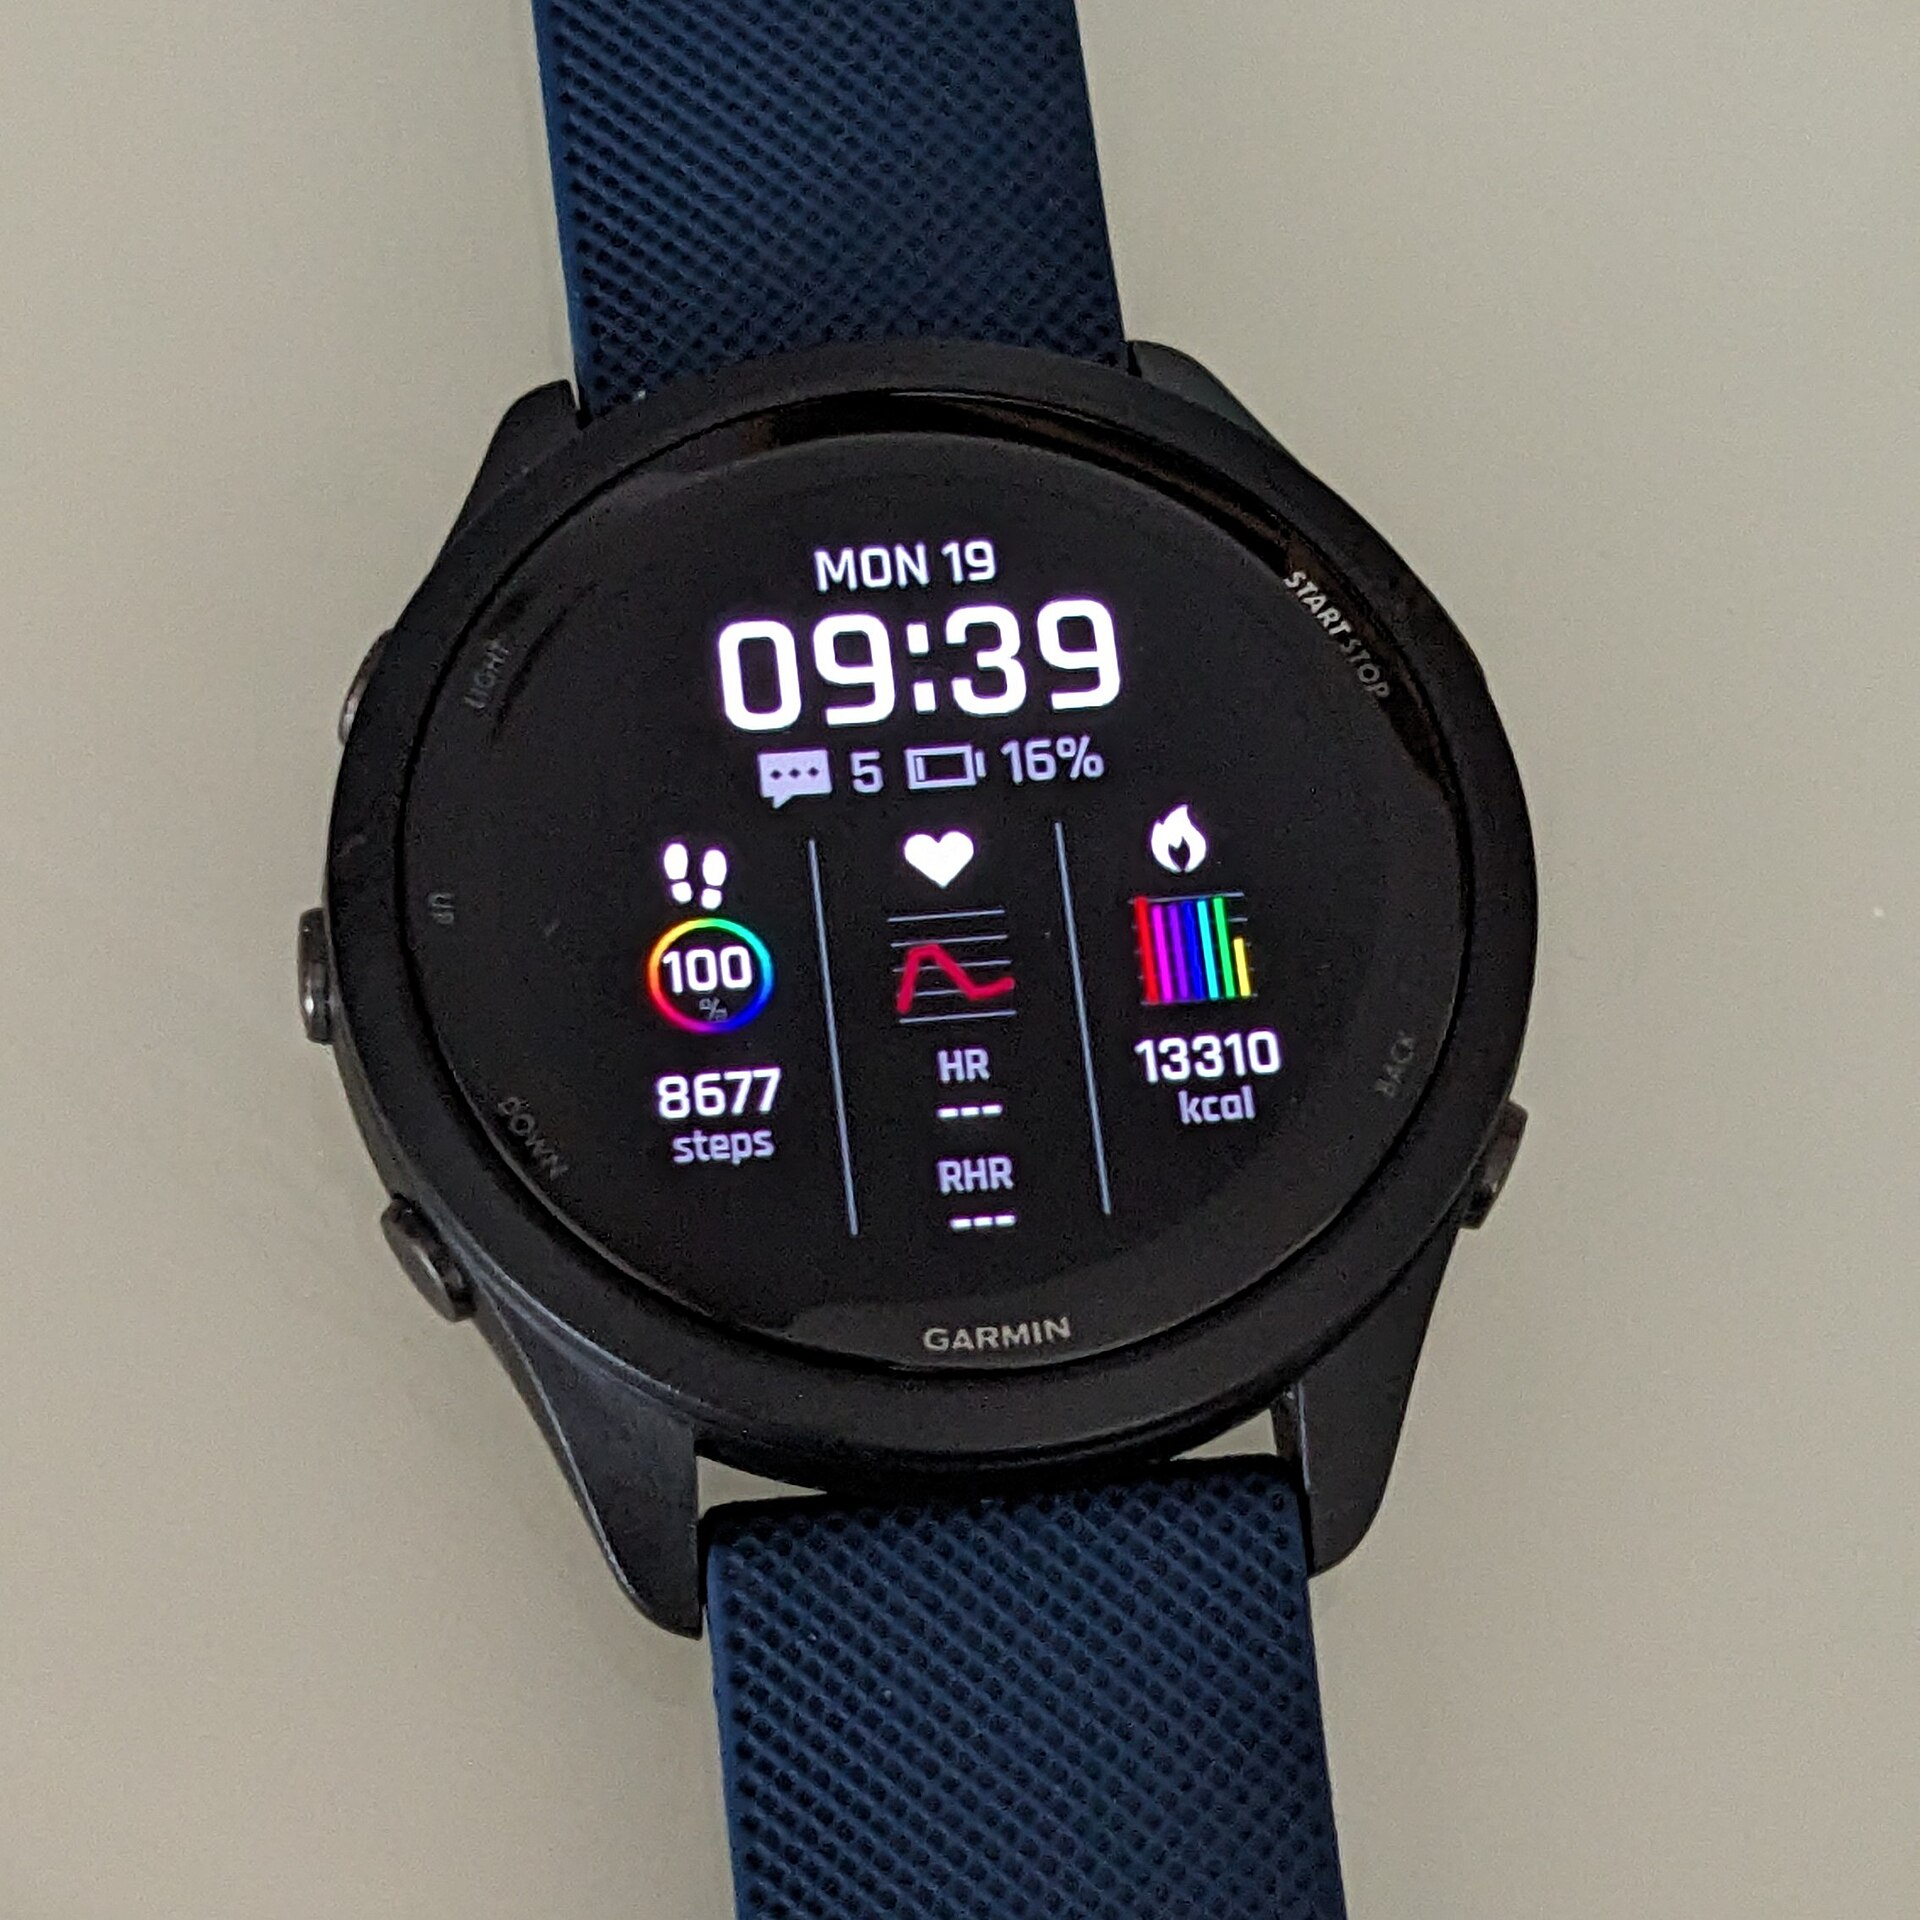
Earnings and the stock move
Garmin reported record third-quarter operating results on October 28 and raised its full-year outlook, while its shares declined. The issuer reported strong outdoor and fitness growth alongside a 20% decline in auto-equipment revenue. Our analysis: investors should examine how much of the margin expansion can continue without tariff refunds, and whether earnings growth converts into cash as capital spending rises.
Q3 2026 earnings recap
Garmin fell 7.76% to $266.89 on October 28, 2026 despite record quarterly operating profit and a higher full-year outlook. The quality of margin gains and cash generation deserve a closer look.
- Garmin sells sports watches, outdoor devices, aircraft systems and marine electronics. Revenue rose 12% to $1.99 billion, while operating profit grew 34% to $612 million.
- Pro forma EPS, or profit per share excluding currency effects and specified tax items, rose 39% to $2.76. Reported GAAP profit per share was $2.8.
- The full-year pro forma profit forecast rose to $10.8 per share from $10, an 8% increase. The revenue outlook edged up to $8.15 billion from $8.05 billion.
- Fitness sales rose 16% and outdoor sales rose 20%, supported by wearables and adventure watches. Auto-equipment sales fell 20%, showing that growth remains uneven across the business.
- Gross margin rose to 63.3% from 59.1%, helped by product mix, lower costs and about $33 million of tariff refunds. Refunds boost current profit but should not be assumed to recur each quarter.
- Free cash flow, cash left after capital spending, fell to $293 million from $425 million despite higher earnings. Capital spending increased, so holiday demand and cash conversion are useful next checks.
The decline tests October lows near $265.4–$273. Holding that area and regaining $283–$290 would support a recovery; weaker holiday sales or a break below $265.4 would add risk.
Financials and technicals
Charts through Oct 27, 2026. The session move above may reflect later news.
Technical setup and risks
The October 28 decline tests early-October lows around $265.4–$273. Reclaiming $283–$290 would strengthen a recovery; a close below $265.4 would weaken support. Consumer demand, competition, tariffs and higher investment are risks.
AI-assisted research with source and calculation checks. Prices may be delayed. Technical charts use the stated completed session, which can precede the quoted intraday move. Educational information; investing involves risk.