Carvana earnings: record car sales lift its outlook despite an EPS miss
Earnings results
- EPS miss -17.0%
Actual: $0.39 · Cons.: $0.47 (GAAP diluted Class A; split-adjusted)
- Revenue beat +4.8%
Actual: $8.04B · Cons.: $7.67B (reported revenue)
- Guidance
Targets upper end of prior $2.7B–$3.0B 2026 adjusted EBITDA range

Earnings and the stock move
Record unit sales and an outlook aimed at the upper end of the existing annual adjusted EBITDA range offer a path to higher total profit. The counterweight is a lower adjusted margin and an EPS miss on the selected dated consensus basis. Investors need to judge how much further sales can scale without weakening profitability.
Q3 2026 earnings recap
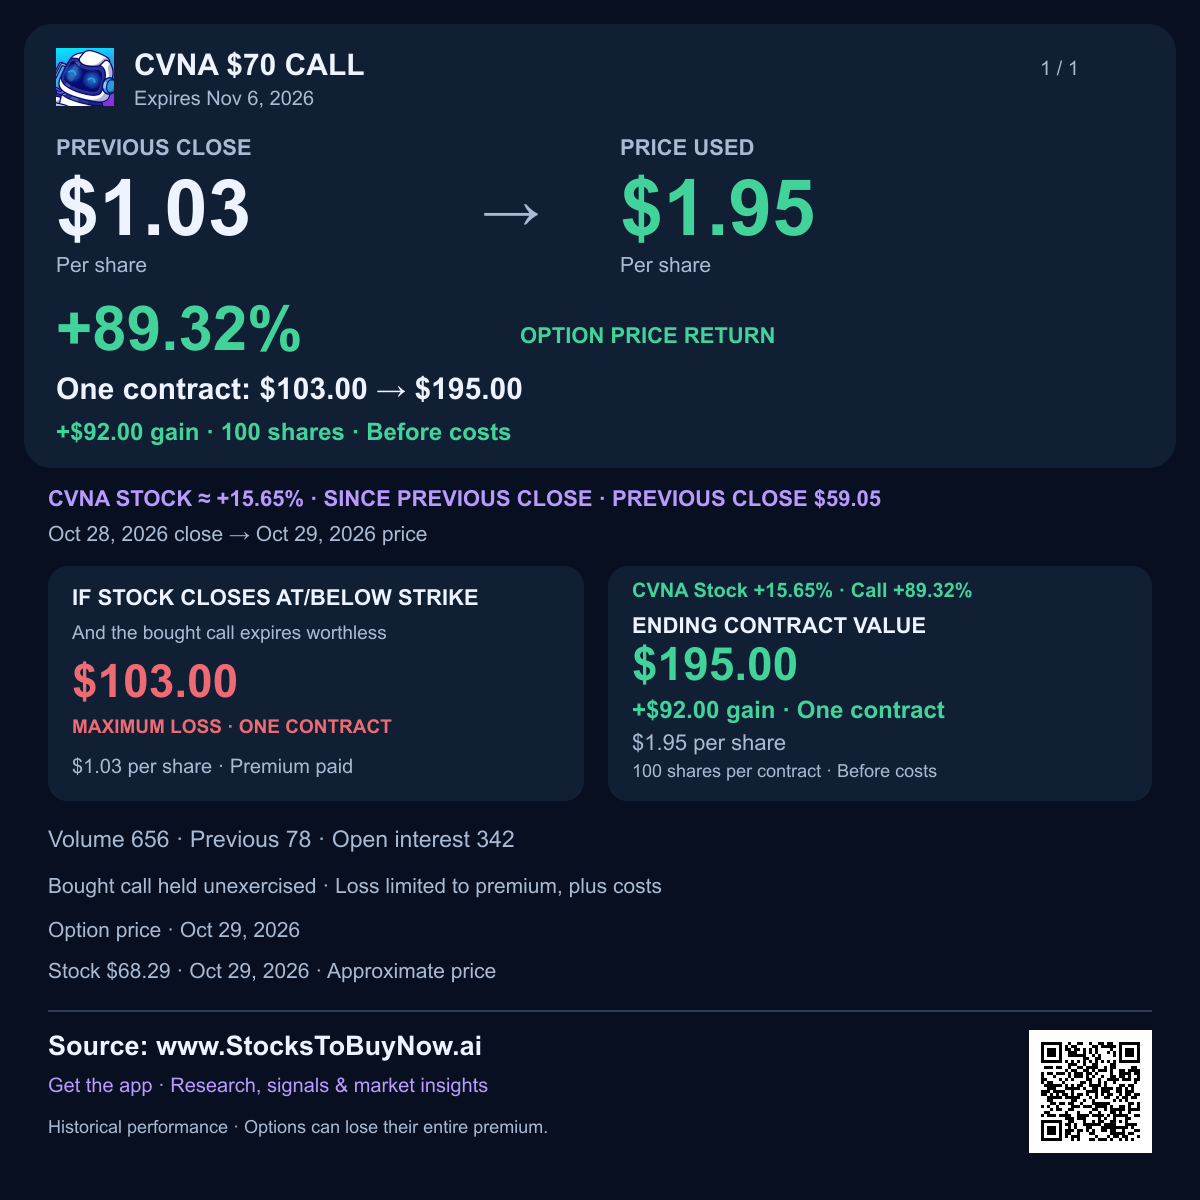
Carvana rose about 16% during trading on October 29 after record quarterly car sales and a stronger profit outlook, despite earnings per share missing expectations.
- Third-quarter revenue reached $8.04 billion, about 4.8% above the dated consensus comparison. More vehicles sold helped drive the increase.
- Carvana sold 217,385 retail vehicles, up 39% from a year earlier. The next test is whether it can keep expanding without sacrificing profit per sale.
- GAAP earnings per share, or profit per share, were $0.39 versus the $0.47 consensus comparison, a 17.0% miss.
- Management now targets the upper end of its existing $2.7 billion–$3 billion annual adjusted EBITDA range. That measure excludes interest, taxes and several other costs.
- Adjusted EBITDA margin narrowed to 10.0% from 11.3% a year earlier. Sales growth therefore did not translate into a higher margin on this measure.
- Carvana expects retail vehicle sales to increase again in the fourth quarter if conditions remain stable. Car prices, financing costs and inventory execution remain risks.
Watch whether fourth-quarter growth preserves profitability. The completed October 28 charts precede the earnings advance, so the next close will help assess follow-through.
Financials and technicals
Charts through Oct 28, 2026. The session move above may reflect later news.
Technical setup and risks
The completed charts end October 28, before earnings. Holding the next-day advance with continued buying would improve momentum; giving back the gap would weaken the reaction. Compare closing prices and volume rather than treating an intraday bounce as proof of a lasting trend.
AI-assisted research with source and calculation checks. Prices may be delayed. Technical charts use the stated completed session, which can precede the quoted intraday move. Educational information; investing involves risk.