T · MARKET MOVERS · October 22, 2026
Why AT&T (T) Stock Is Down After Hours
$21.73 · Snapshot as of

What is behind the stock move?
AT&T fell in October 22 after-hours trading; its third-quarter results were released on October 21, rather than this evening. The earnings timing is verified; no same-evening issuer earnings release is being asserted.
Latest company research
AT&T fell in October 22 after-hours trading; its third-quarter results were released on October 21, rather than this evening.
- Third-quarter revenue totaled $32.322 billion, up 5.3%, while adjusted EPS rose to $0.65 from $0.54.
- GAAP EPS from continuing operations was $0.13, including Mexico-related impairment and employee separation charges.
- Management increased its full-year adjusted EPS outlook to around $2.40 and maintained free cash flow guidance of at least $18 billion.
- Quarterly free cash flow reached $5.0 billion, with $10.5 billion of operating cash flow and $5.6 billion of capital investment.
- The company added 442,000 fiber, 327,000 fixed-wireless and 379,000 postpaid phone connections.
- Total debt reached $159.6 billion and net debt was $149.8 billion following the EchoStar spectrum transaction.
Investors are weighing connectivity growth against debt, spending and legacy-network declines; the after-hours move alone does not establish its cause.
Financials and technicals
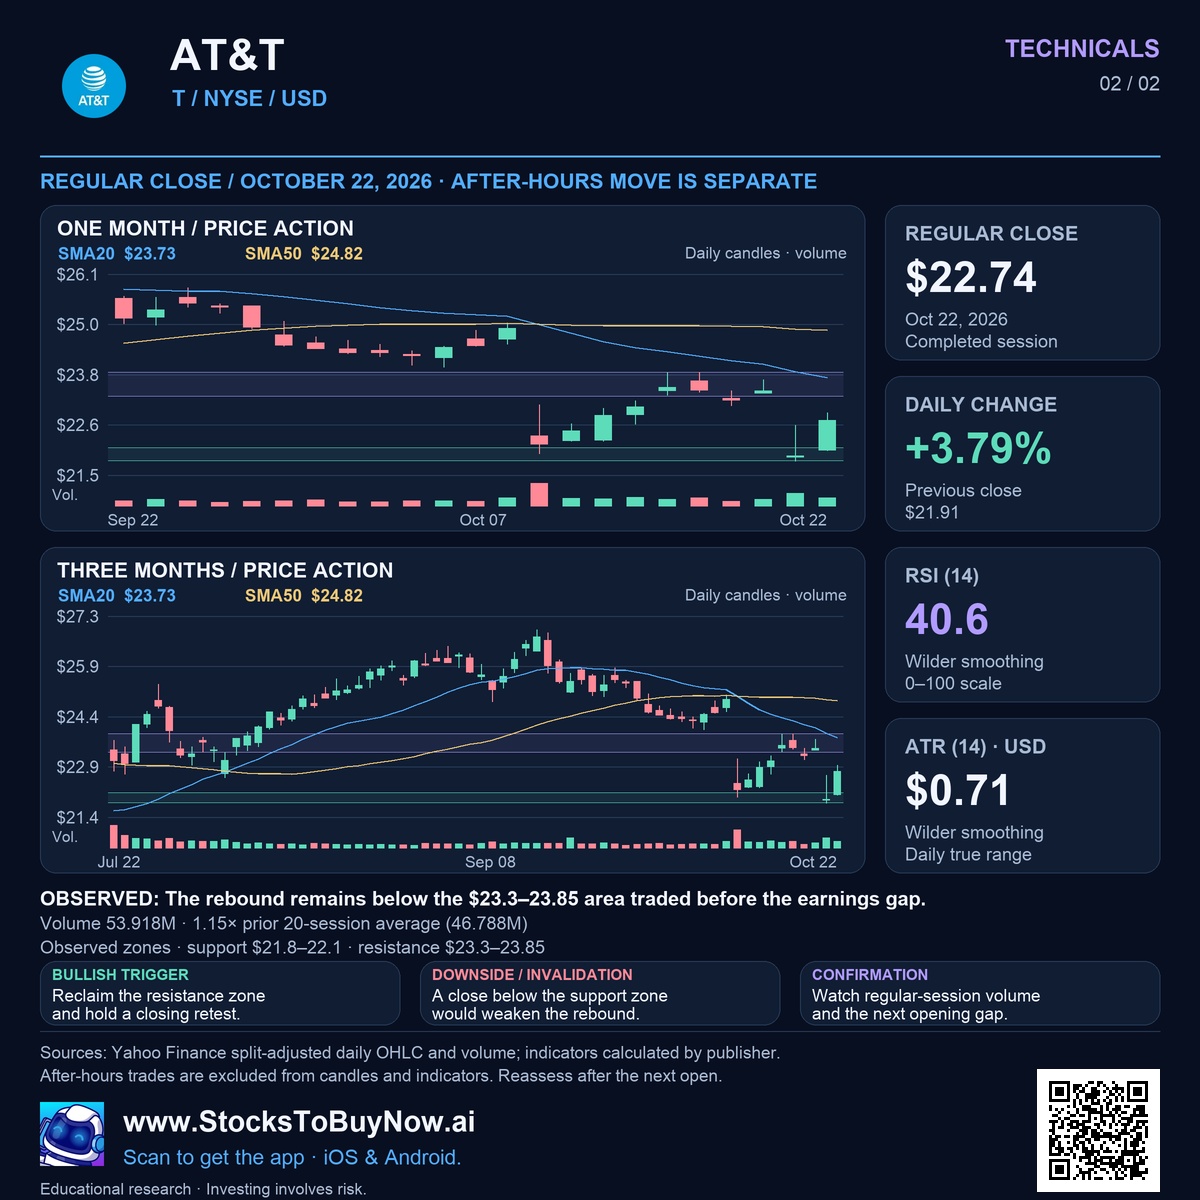
Technical charts use the October 22, 2026 completed close. The session move above may reflect news released after that close.
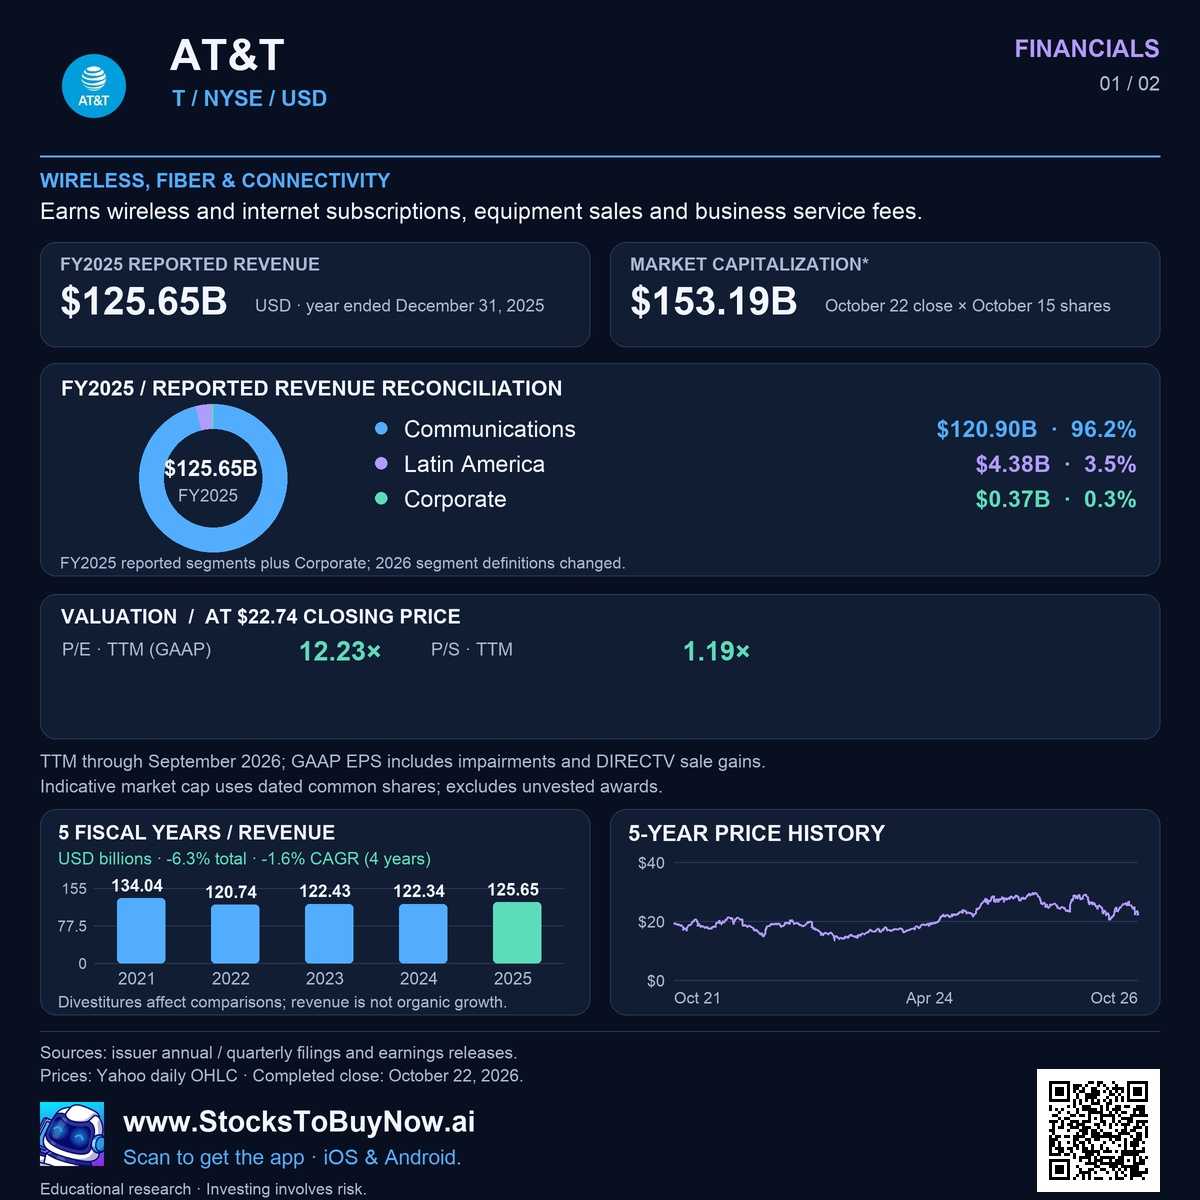
Financials
Technicals
AT&T (T) stock information
Earns wireless and internet subscriptions, equipment sales and business service fees.
WIRELESS, FIBER & CONNECTIVITY. Financial and valuation snapshot at the October 22, 2026 completed close; estimates and reporting dates are shown in the financial infographic.
- Completed close · October 22, 2026
- $22.74
- Indicative market capitalization
- $153.19 billion
- FY2025 revenue
- $125.65 billion
- P/E · TTM GAAP
- 12.23×
- RSI (14) · October 22, 2026
- 40.6
Explore AT&T stock financials, earnings and research →
Technical setup and risks
The rebound remains below the $23.3–23.85 area traded before the earnings gap. Observed zones · support $21.8–22.1 · resistance $23.3–23.85. A closing reclaim of resistance would strengthen the setup; a close below support would weaken it. Confirm using regular-session volume and retests. These are observed zones, not guaranteed turning points. After-hours trades are excluded from the technical chart.
Follow the research in the app
Open this report and follow the discussion.
Open T research in the app →