Share Ross earnings preview for November 19, 2026: can shopper growth carry into the holidays?

EARNINGS & CATALYSTS · November 18, 2026

Ross earnings preview for November 19, 2026: can shopper growth carry into the holidays?

Ross heads into earnings after strong customer traffic and 115 new store openings. Watch whether holiday sales and profit margins can sustain the momentum beyond tariff refunds.
By Stocks To Buy Now AI Research · Published

200
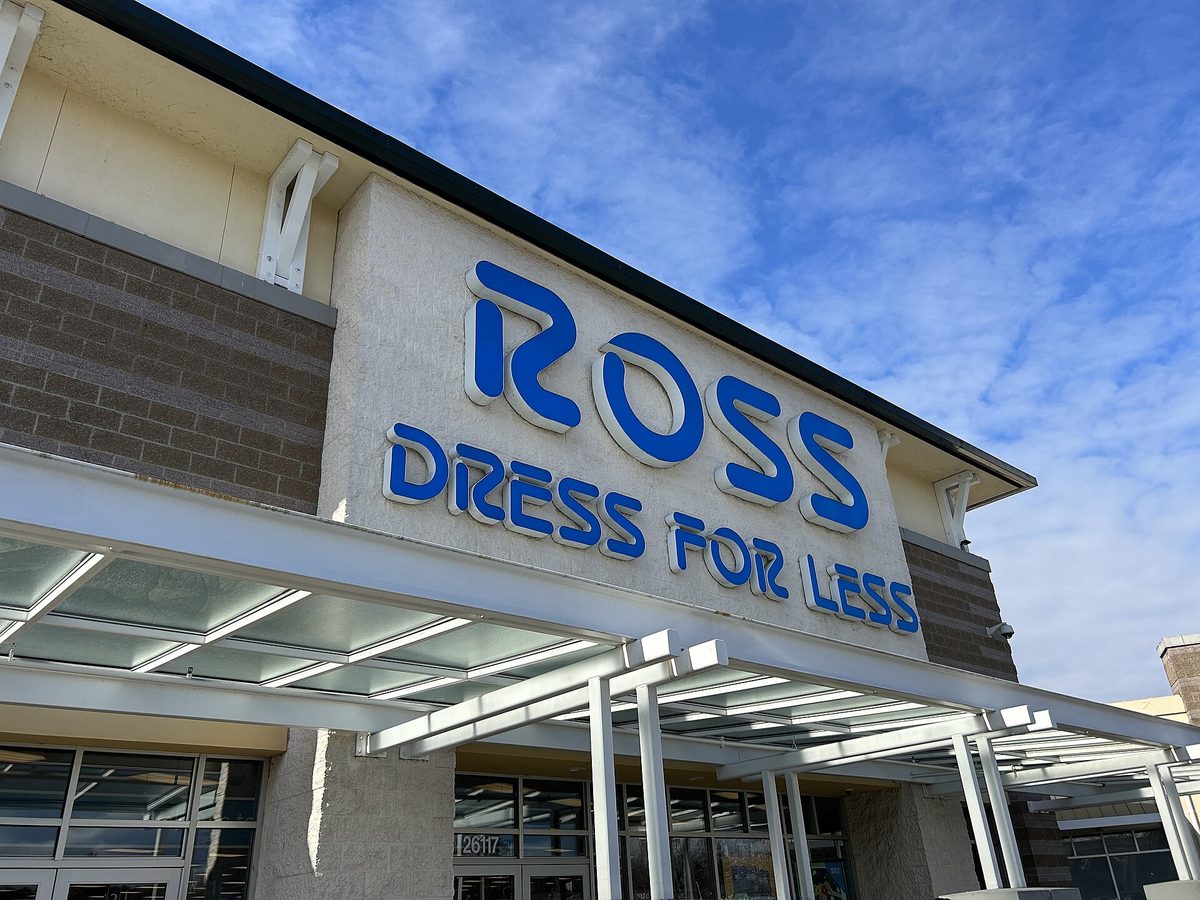
Ross Dress for Less storefront in Kent, Washington.
Archive photograph of a Ross Dress for Less store in Kent, Washington, on March 6, 2024; illustrative of the retail business. Photo: Roc0ast3r / Wikimedia Commons · CC0 · Resized to at most 1200px wide and JPEG compressed; a smaller feed preview is available.
Financials
Technicals
Earnings & peers
Earnings calendar snapshot · dates in New York time
CompanyReport dateWindowEPS estimateRevenue estimate
Ross Stores, Inc. (ROST)November 19, 2026Issuer confirmedAfter close1.876.25B

1) When does Ross report, and what is the hurdle?

Ross has confirmed its fiscal third-quarter results for November 19, 2026, after close. MarketBeat’s November 18 consensus display lists $1.87 profit per share and about $6.25 billion of sales. Estimates are forecasts, not reported results. Management’s August outlook called for $1.75–$1.83 profit per share and 6%–7% growth in sales at established stores, so simply reaching the company’s range may not satisfy expectations.

2) Separate shopper growth from tariff refunds

Second-quarter sales rose to $6.26 billion. More shoppers were the main driver of the 10% gain at established stores. Reported profit per share was $2.66; excluding approximately $0.60 of tariff refunds, it was about $2.06, above the $1.93 Zacks estimate. Investors should watch merchandise profitability and customer visits rather than assume a refund will repeat.

3) New stores broaden the opportunity

Ross completed 115 openings during fiscal 2026, including 51 locations in September and October. This gives the company more selling space ahead of the holiday season. The investment question is whether those stores build sales quickly enough to cover their operating costs while existing locations retain customers.

4) What recent retail results tell us

Target reported on November 18 that comparable sales rose 5.6%, with traffic up 5.0%, and raised its full-year sales-growth outlook to around 6%. That supports the case for consumers responding to value and fresh merchandise, but Target’s broader product mix and online business differ from Ross. Target’s $2.65 profit per share includes a $0.50 tariff refund, another reason to separate recurring performance from refunds.

5) The holiday outlook matters most

In August, Ross projected 4%–5% growth at established stores in the fourth quarter and profit per share of $2.17–$2.26. An improved outlook supported by customer traffic and healthy merchandise margins would strengthen the investment case. Slower demand, heavier markdowns or higher costs would weaken it.

6) Price and risk before the announcement

Ross closed November 17 at $220.45 after a recent decline. The chart’s nearby areas are approximately $219–$222 for support and $228–$233 for resistance. These are areas where trading may change, not guaranteed floors or ceilings; the earnings release can move the stock past them abruptly.

7) How the business makes money

Ross sells discounted clothing, footwear and home goods through Ross Dress for Less and dd’s DISCOUNTS. Its buying teams seek attractive branded merchandise at low costs, making inventory selection and quick turnover central to profitability.

8) What to watch

The key test is whether more customer visits can sustain sales while protecting profit margins. The holiday-quarter outlook matters because management entered the fall expecting slower growth than in the first half. New stores add another source of sales, but also require staffing and inventory.

9) Recently reported peers

Target reported on November 18 that comparable sales rose 5.6%, with traffic up 5.0%, and raised its full-year sales-growth outlook to around 6%. That supports the case for consumers responding to value and fresh merchandise, but Target’s broader product mix and online business differ from Ross. Target’s $2.65 profit per share includes a $0.50 tariff refund, another reason to separate recurring performance from refunds.

10) Risks into the report

A sales increase can still disappoint if discounting, wages or import costs absorb the benefit. Strong previous results raise the bar for the outlook, while tariff refunds can make reported profit look stronger than the recurring business. Earnings announcements can move shares sharply in either direction.

11) Insider activity over the past three months

$0 bought and $12.77M sold in reported trades. 0% buy / 100% sell by value. 0 insiders bought only, 2 sold only, and 0 did both.

AI-assisted research. Earnings dates and estimates may change. Estimates are not reported results. Educational information; investing involves risk.

Explore the stocks in this report

EXPLORE COMPANY RESEARCH

Ross Stores: the full stock picture

Earnings history, financials, price action and peer comparisons — all below.
Open ROST stock page ↗

EXPLORE THE COMPANY

Ross Stores (ROST)

Explore earnings, price action, financials and industry comparisons.

Symbol
ROST
Sector
Consumer Cyclical
Industry
Apparel Retail
Instrument type
EQUITY

Profile information from our saved company catalog. This is not a live quote or confirmation of current listing status.

EARNINGS & COMPANY RESEARCH

ROST earnings, valuation & price action

View in calendar ↗
NEXT EXPECTED REPORTNov 19 2026After close · ET
EPS ESTIMATE1.87
REVENUE ESTIMATE6.25B

Expected dates may change. Estimates use the source’s reporting currency. Quotes and research are snapshots, not live prices.

COMPANY RESEARCH · Consumer Cyclical

Ross Stores, Inc. ROST

Apparel - Retail · Updated 11/18/2026

Adjusted closing price · USD220.45 Nov 17
138179219260Nov 14May 19Nov 17
Price50-day average200-day average+38.4% in view
VALUATION & EXPECTATIONS
Trailing P/E28.3×
Forward P/E26.1×
Trailing P/S3.1×
Forward P/S2.9×
EPS beat rate100%
Revenue beat rate63%
Positive window88%

EPS beats: 8 of 8 comparable reports. Positive price windows: 7 of 8.

Market caps may be up to 14 days old; prices up to seven days old; ratios and analyst estimates up to fourteen days old. Forward multiples use consensus for the fiscal year ending 2027-01-31, not the next 12 months. Negative or unavailable earnings multiples show “N/A”. Forward ADR multiples are omitted when the currency/share basis is not reconciled.

50-day average231.31
200-day average224.53
RSI (14)39
20-day range222.99 – 245.74
Relative volume1.3×
1-year change+38.4%
Last eight reported earnings for ROST
Report dateEPS estimateEPS actualSurpriseResultRevenue actualPrice window*5 sessions*
Aug 20 20261.952.66+36.4%Beat6.26B+1.9%-2.1%
May 21 20261.732.02+16.8%Beat6.01B+7.8%+6.4%
Mar 3 20261.902.00+5.3%Beat6.64B+5.5%+5.3%
Nov 20 20251.421.58+11.3%Beat5.6B+8.4%+9.9%
Aug 21 20251.531.56+2.0%Beat5.53B+0.6%+1.8%
May 22 20251.441.47+2.1%Beat4.98B-10.1%-8.2%
Mar 4 20251.661.79+7.8%Beat5.91B+1.3%-6.0%
Nov 21 20241.411.48+5.0%Beat5.07B+4.9%+11.2%

*Adjusted close before the report date to the first (or fifth) trading close after it. This window can span two sessions and is not an isolated earnings-day return. Figures may be revised by the provider.

Smart Money activity

Recent insider and politician transactions, and disclosed fund positions for ROST.

Get Pro to see what insiders are doing ahead of earnings.

Explore insider trades, fund holdings and politician activity with an active Pro membership.

Checking membership…

ROST earnings previews and market catalysts

Ross earnings preview for November 19, 2026: can shopper growth carry into the holidays?
2026-11-18 · Ross heads into earnings after strong customer traffic and 115 new store openings. Watch whether holiday sales and profit margins can sustain the momentum beyond tariff refunds.

This Week’s Market Forecast: Your Day-by-Day Outlook (November 16–20, 2026 | U.S. Eastern Time)
2026-11-15 · Retail sales, Fed minutes and NVIDIA’s first earnings call under interim leadership shape the November 16–20 outlook, alongside major retailers, cybersecurity and business-software reports.

October 26, 2026 premarket recap: FICO and Moderna slide as travel stocks rise
2026-10-26 · Ross rose after a UBS upgrade; FICO slid after a Wells Fargo downgrade. Moderna’s cancer-trial reaction and EQT’s signed Range deal round out the key news before open on October 26.

All upcoming earnings catalysts →

02 / FINANCIALS

Ross Stores financials

Revenue, earnings, cash flow and financial strength in one view.

Reporting currency unconfirmed.

Revenue
Net income
Gross profit
Operating income
EBITDA
Operating cash flow
Capital expenditure
Cash
Total assets
Total liabilities
Shareholder equity
Total debt
Net profit margin
Gross margin
Short interest: days to cover
How to read these financial metrics

Figures use the app’s saved statements for the displayed period, not a trailing-year total. Margins divide profit by revenue; quick ratio uses current assets less inventory divided by current liabilities. Compare dates and currencies before comparing companies.

03 / WHAT COMES NEXT

Ross Stores event catalysts

Company earnings and scheduled market events that may change expectations.

2026-11-19

ROST earnings

Watch reported results, management’s outlook and the share-price reaction.

See earnings expectations ↑
2026-11-188:30 AM ET

Housing starts & building permits

Housing is sensitive to interest rates. Watch permits for indications of future building activity.

Release schedule ↗Scheduled
2026-11-182:00 PM ET · expected

FOMC minutes

Methodology-based date; confirm the Fed calendar closer to release.

Release schedule ↗Rule-based date
2026-11-198:30 AM ET

Initial jobless claims

Use the multiweek trend to distinguish normal volatility from a sustained increase in layoffs.

Release schedule ↗Scheduled
2026-11-2010:00 AM ET

Consumer sentiment · final

Watch changes in inflation expectations as well as sentiment.

Release schedule ↗Scheduled
2026-11-20Contract-specific cutoff

Monthly options expiration

Check your contract. Position unwinds and hedging can affect trading volume.

Release schedule ↗Scheduled
2026-11-20Time not announced

Russell · membership list update

Track revisions before the effective date; index flows do not guarantee a price rise.

Release schedule ↗Scheduled
2026-11-258:30 AM ET

Durable goods orders

Read core capital-goods orders alongside the headline; aircraft orders can create large swings.

Release schedule ↗Scheduled
2026-11-258:30 AM ET

Initial jobless claims

Use the multiweek trend; a single reading can be noisy. Thanksgiving release moves to Wednesday.

Release schedule ↗Scheduled

Dates use U.S. Eastern time and can change. Calendar events provide context; they do not determine the direction of a stock move.

04 / SIDE BY SIDE

Compare ROST with its peers

Apparel - Retail · Compare valuation, financial strength and price performance.

Companies with valuation data7
Peer median positive P/E10.1×
ROST P/E28.3×
ROST peer comparison: valuation
CompanyPriceMarket capP/EForward P/EP/SForward P/S
ROSTRoss Stores2026-11-17 · USD220.4575.71B28.3×26.1×3.1×2.9×
AEOAmerican Eagle Outfitters, Inc.2026-11-18 · USD22.343.41B10.2×11.6×0.6×0.6×
BURLBurlington Stores, Inc.2026-11-16 · USD235.1616.23B23.2×19.8×1.3×1.3×
GAPThe Gap, Inc.2026-11-17 · USD19.507.92B6.6×8.2×0.5×0.5×
JILLJ.Jill, Inc.2026-11-17 · USD21.65256.41M12.5×9.0×0.4×0.4×
KSSKohl's Corporation2026-11-17 · USD23.092.72B10.0×10.8×0.2×0.2×
MMacy's, Inc.2026-11-17 · USD23.396.41B8.8×10.1×0.3×0.3×
ROST28.3×
AEO10.2×
BURL23.2×
GAP6.6×
JILL12.5×
KSS10.0×
M8.8×

The peer median excludes the selected stock and is based on 6 available positive multiples. P/E median excludes negative or missing earnings multiples. Peer reports can have different fiscal periods and currencies; values are not currency-converted.

05 / PEER ANALYSIS

Explore ROST alongside its peers

Apparel Retail · 6 companies · Cached market data

Comparison

Compare companies

Tap a bubble to inspect a company, then × to hide it. Undo restores the last company hidden. Bubble area reflects market cap, with a minimum size for visibility.

Price / sales
0.8×01.7×56.41B2.7×112.81B3.6×169.22BTJX · TJX Companies Market cap: 152.83B Price / sales: 2.5×BURL · Burlington Stores Market cap: 16.23B Price / sales: 1.3×ROST · Ross Stores, Inc. Market cap: 75.71B Price / sales: 3.1×Hide ROST · Undo restores itMarket cap
ROSTRoss Stores, Inc.

Market cap: 75.71B
Price / sales: 3.1×

Valuation snapshot: 2026-11-17
3 of 6 companies have both plotted values.

P/S distribution

Trailing price-to-sales multiples · 3 companies

Median P/S2.5×
Middle 50%1.9× to 2.8×
ROST P/S3.1×
ROST
1.2×3.2×

Tap a bar to see the companies in that P/S range. ROST has a higher P/S than 67% of this group.

3 companies excluded from P/S statistics because sales are non-positive or the saved multiple is missing. Statistics include all valid positive values, including those outside the focused chart range.

Companies

Showing 6 of 6 matching companies · Largest market cap first

  • Market cap 152.83BP/E 25.7×P/S 2.5×Forward P/E Forward P/S Price snapshot: 2026-11-17
    ↗
  • Market cap 75.71BP/E 28.3×P/S 3.1×Forward P/E Forward P/S Price snapshot: 2026-11-17
    ↗
  • Market cap 16.23BP/E 23.2×P/S 1.3×Forward P/E Forward P/S Price snapshot: 2026-11-16
    ↗
  • Market cap 14.04BP/E P/S Forward P/E Forward P/S Catalog snapshot
    ↗
  • Market cap 6.65BP/E P/S Forward P/E Forward P/S Catalog snapshot
    ↗
  • Market cap 552.38MP/E P/S Forward P/E Forward P/S Catalog snapshot
    ↗

Explore industries

Open an industry for its comparison, valuation and companies.

U.S.-listed companies from the app’s catalog. Medians use saved positive P/E values; coverage and snapshot dates vary.

How this comparison works

Uses the saved companies from the same industry and listing market, including ROST, ordered by cached market cap. Company snapshots can have different dates; the web cache may cover fewer metrics and periods than the app.

Periods end at each company’s dated price snapshot. Change compares the latest saved observation with one at or before the selected period’s start. A daily price change uses consecutive saved sessions. Financial data updates quarterly, so short periods may show no change. Missing history and zero starting values are excluded; a negative starting value uses its absolute value as the denominator.

Metrics use saved ratios and percentages. Market caps use the listing market’s reporting currency; underlying financial statements may use different currencies. Circle sizes have a minimum for touch visibility, and an outlined circle indicates a missing market cap. These comparisons describe data, not recommendations or price predictions.

INDUSTRY COMPARISON

ROST industry peers

Apparel Retail · Oct 16, 2026 · Closing-price performance

No industry peers are available in the current heatmap coverage.