EARNINGS & CATALYSTS · November 4, 2026
Monster Beverage earnings preview for November 5, 2026: can overseas growth cover higher selling costs?
Monster reports after close on November 5. Watch overseas demand, marketing spending and can costs to judge whether sales growth is translating into stronger profit margins.
| Company | Report date | Window | EPS estimate | Revenue estimate |
|---|---|---|---|---|
| Monster Beverage Corporation (MNST) | November 5, 2026Issuer confirmed | After close | 0.30 | 2.49B |
1) What is confirmed and what do analysts expect?
Monster confirmed it will report results for the quarter ended September 30, 2026 after close on November 5. Analyst forecasts checked before open on November 4 were about $2.49 billion of revenue and $0.30 in EPS, or profit per share. Those expectations are not reported results. The upcoming EPS forecast uses the share count after the August two-for-one stock split. Monster did not issue a quantified annual sales or EPS range in its first- or second-quarter release. Management’s discussion of demand, pricing and costs therefore matters alongside the headline comparison with analyst forecasts.
2) Why do international growth and selling costs matter?
Monster’s second-quarter sales to customers outside the United States rose 34.6%, or 29.0% after removing currency changes. That shows overseas growth was more than a translation benefit from exchange rates. More cases sold can spread fixed costs across a larger business, although the countries and products driving growth also affect profitability. Selling expenses reached 10.6% of revenue versus 9.3% a year earlier as Monster increased advertising, sponsorships and other marketing. The investment question is whether those costs attract repeat customers and support lasting growth. Higher sales alone would not settle it.
3) What did the last two quarters show?
First-quarter net sales were $2.353 billion versus roughly $2.16 billion expected. Adjusted diluted EPS was about $0.29 versus $0.265 expected after allowing for the August stock split. Second-quarter net sales were $2.537 billion versus roughly $2.43 billion expected, with adjusted diluted EPS of about $0.30 versus $0.29 on the same share basis. Adjusted profit excludes selected costs; diluted EPS also allows for shares that could be issued. Second-quarter gross margin was 55.9%, slightly above the year-earlier 55.7%. Pricing and product mix helped, while aluminum-can costs, regional sales mix and freight worked against them. Operating margin declined because operating costs grew faster than sales. That makes the balance between brand investment and profit a useful test for the next report.
4) What does the chart add?
Monster closed November 3 at $47.18, down about 1.7% for the day but above its 20-day average near $45.65 and 50-day average near $44.73. Late-October lows around $44.90–45.30 form an approximate support area. Recent highs around $47.80–48.50 form resistance. Holding above resistance would strengthen the setup; losing support would weaken it. The first full session after the May report finished about 13.6% above the release-day close. The comparable August reaction was a decline of about 4.0%, despite earnings beating forecasts. Results and outlook can move the stock through chart levels, so these past reactions are context rather than predictions.
5) How the business makes money
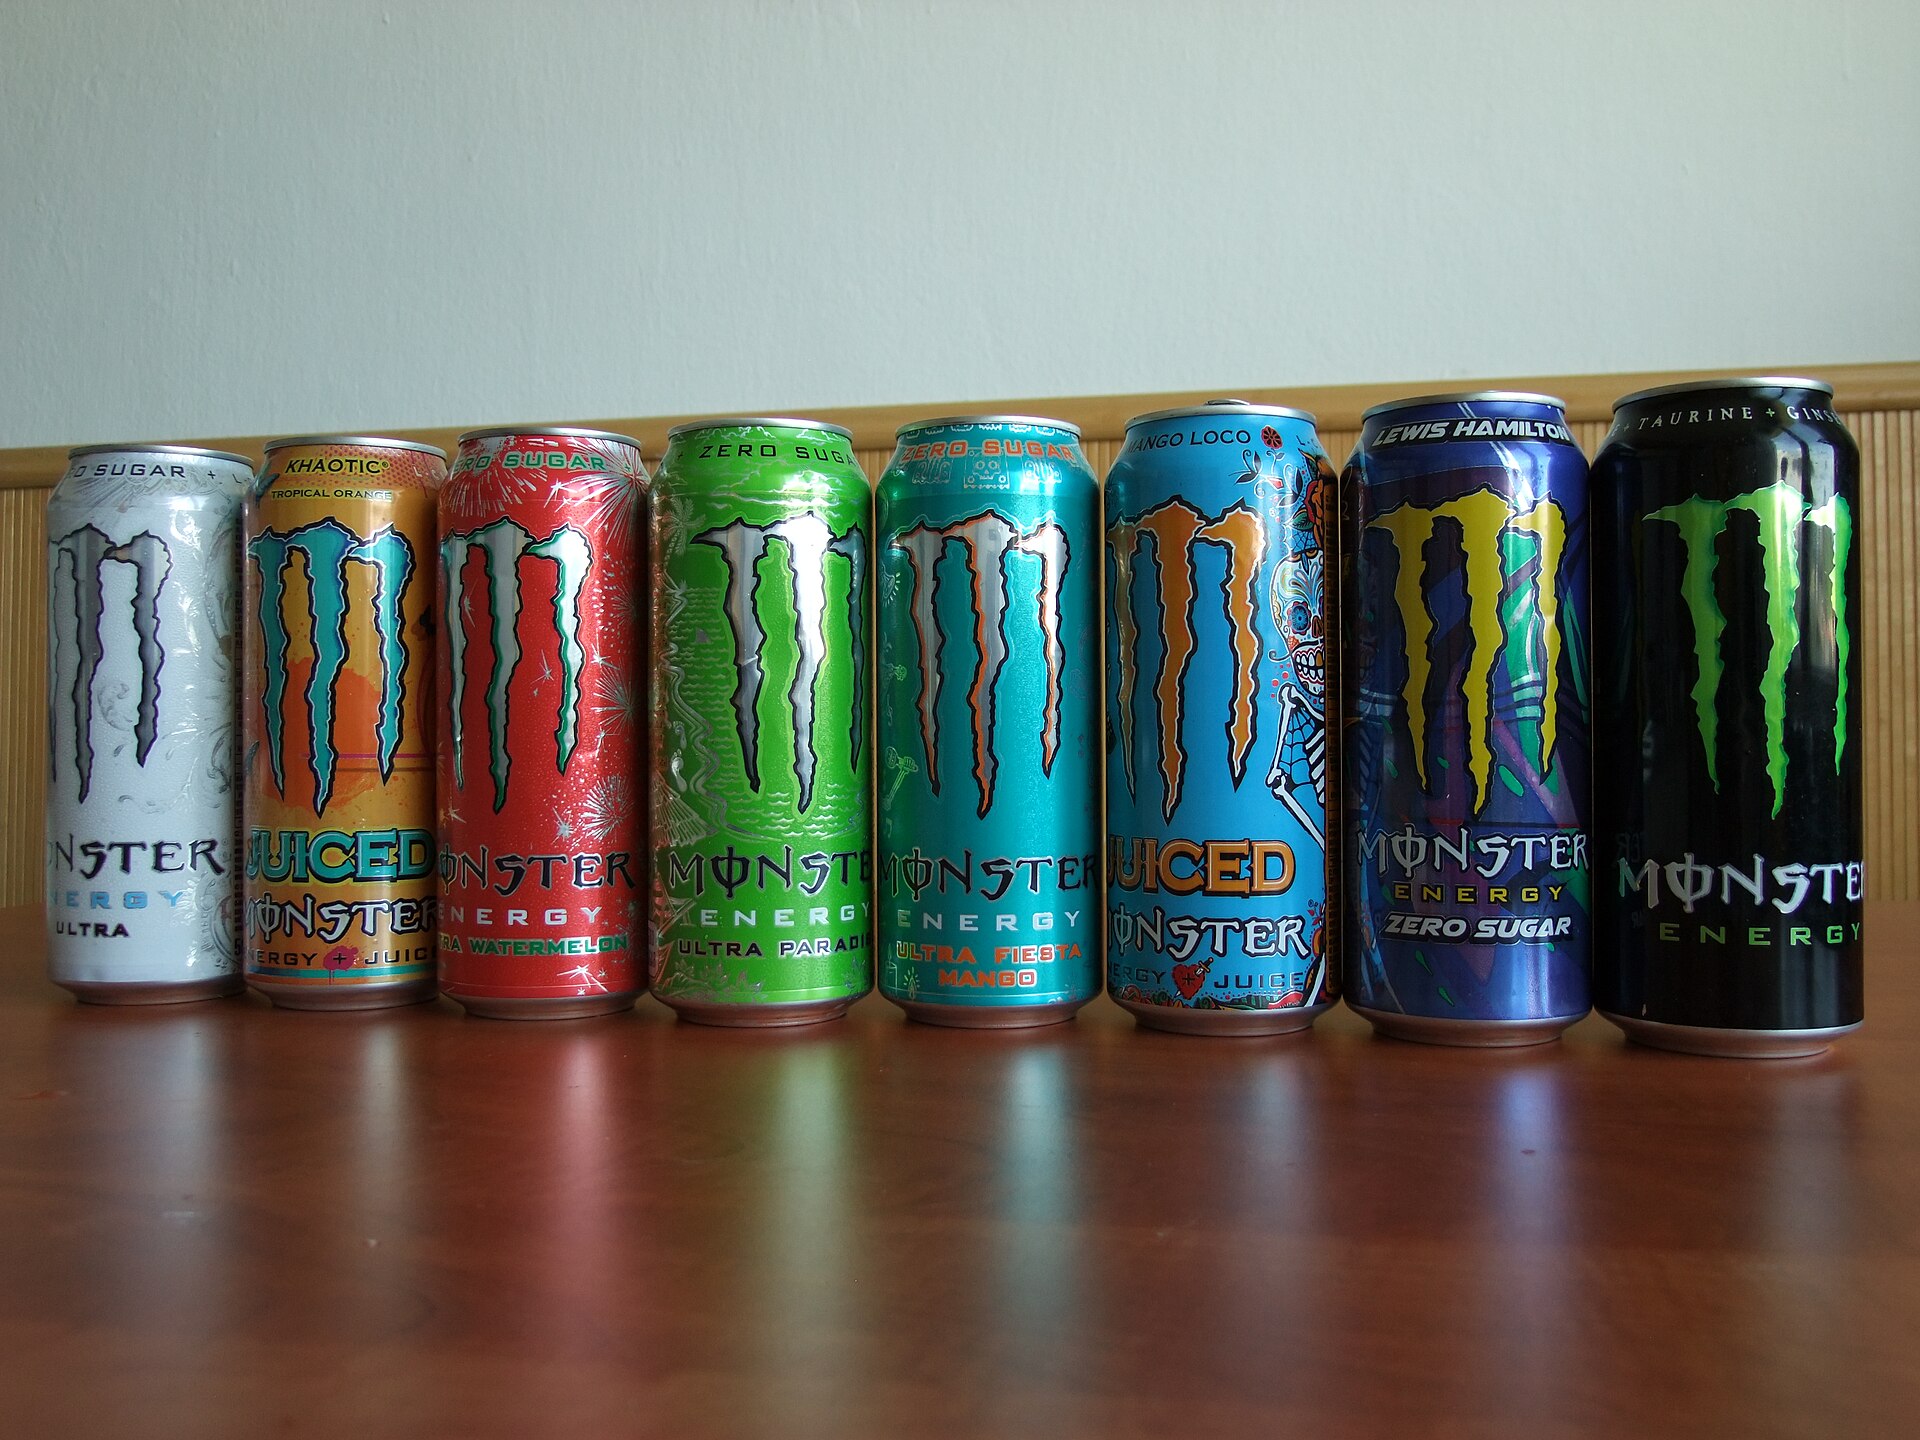
Monster develops and markets energy drinks, selling through distributors and retailers, including the Coca-Cola distribution system. Its core Monster Energy drinks segment supplied about 92% of 2025 revenue. Sales depend on how many drinks customers buy, pricing, product mix and distribution reach; marketing and packaging costs determine how much revenue becomes profit.
6) What to watch
Watch international sales excluding currency effects, case volumes and the cost of recruiting new consumers. The next report can show whether increased marketing is sustaining demand without steadily taking a larger share of revenue. Comments on pricing, can costs and freight will also help explain whether stronger sales can improve margins.
7) Recently reported peers
Coca-Cola reported on October 27 that unit-case volume rose 5% and comparable EPS reached $0.91, above roughly $0.881 expected. It raised its annual comparable EPS growth outlook to at least 11% from 9–10%. That offers evidence of broader beverage demand, but Coca-Cola sells many categories beyond energy drinks and has a different geographic mix. Its result cannot establish Monster’s next quarter or stock reaction.
8) Risks into the report
Competition can require more advertising or promotions, while higher packaging and freight costs can erode profit. Overseas expansion adds currency and regional pricing risks. A strong sales result can still disappoint investors if spending rises faster or management signals weaker demand ahead.