Share Amgen earnings ahead: can drug growth offset competition and fund new treatments?

EARNINGS & CATALYSTS · October 29, 2026

Amgen earnings ahead: can drug growth offset competition and fund new treatments?

Amgen reports after close on November 3. Growing medicines and a higher annual outlook support the business, while competition, research spending and clinical milestones will shape how much growth reaches shareholders.
By Stocks To Buy Now AI Research · Published

590
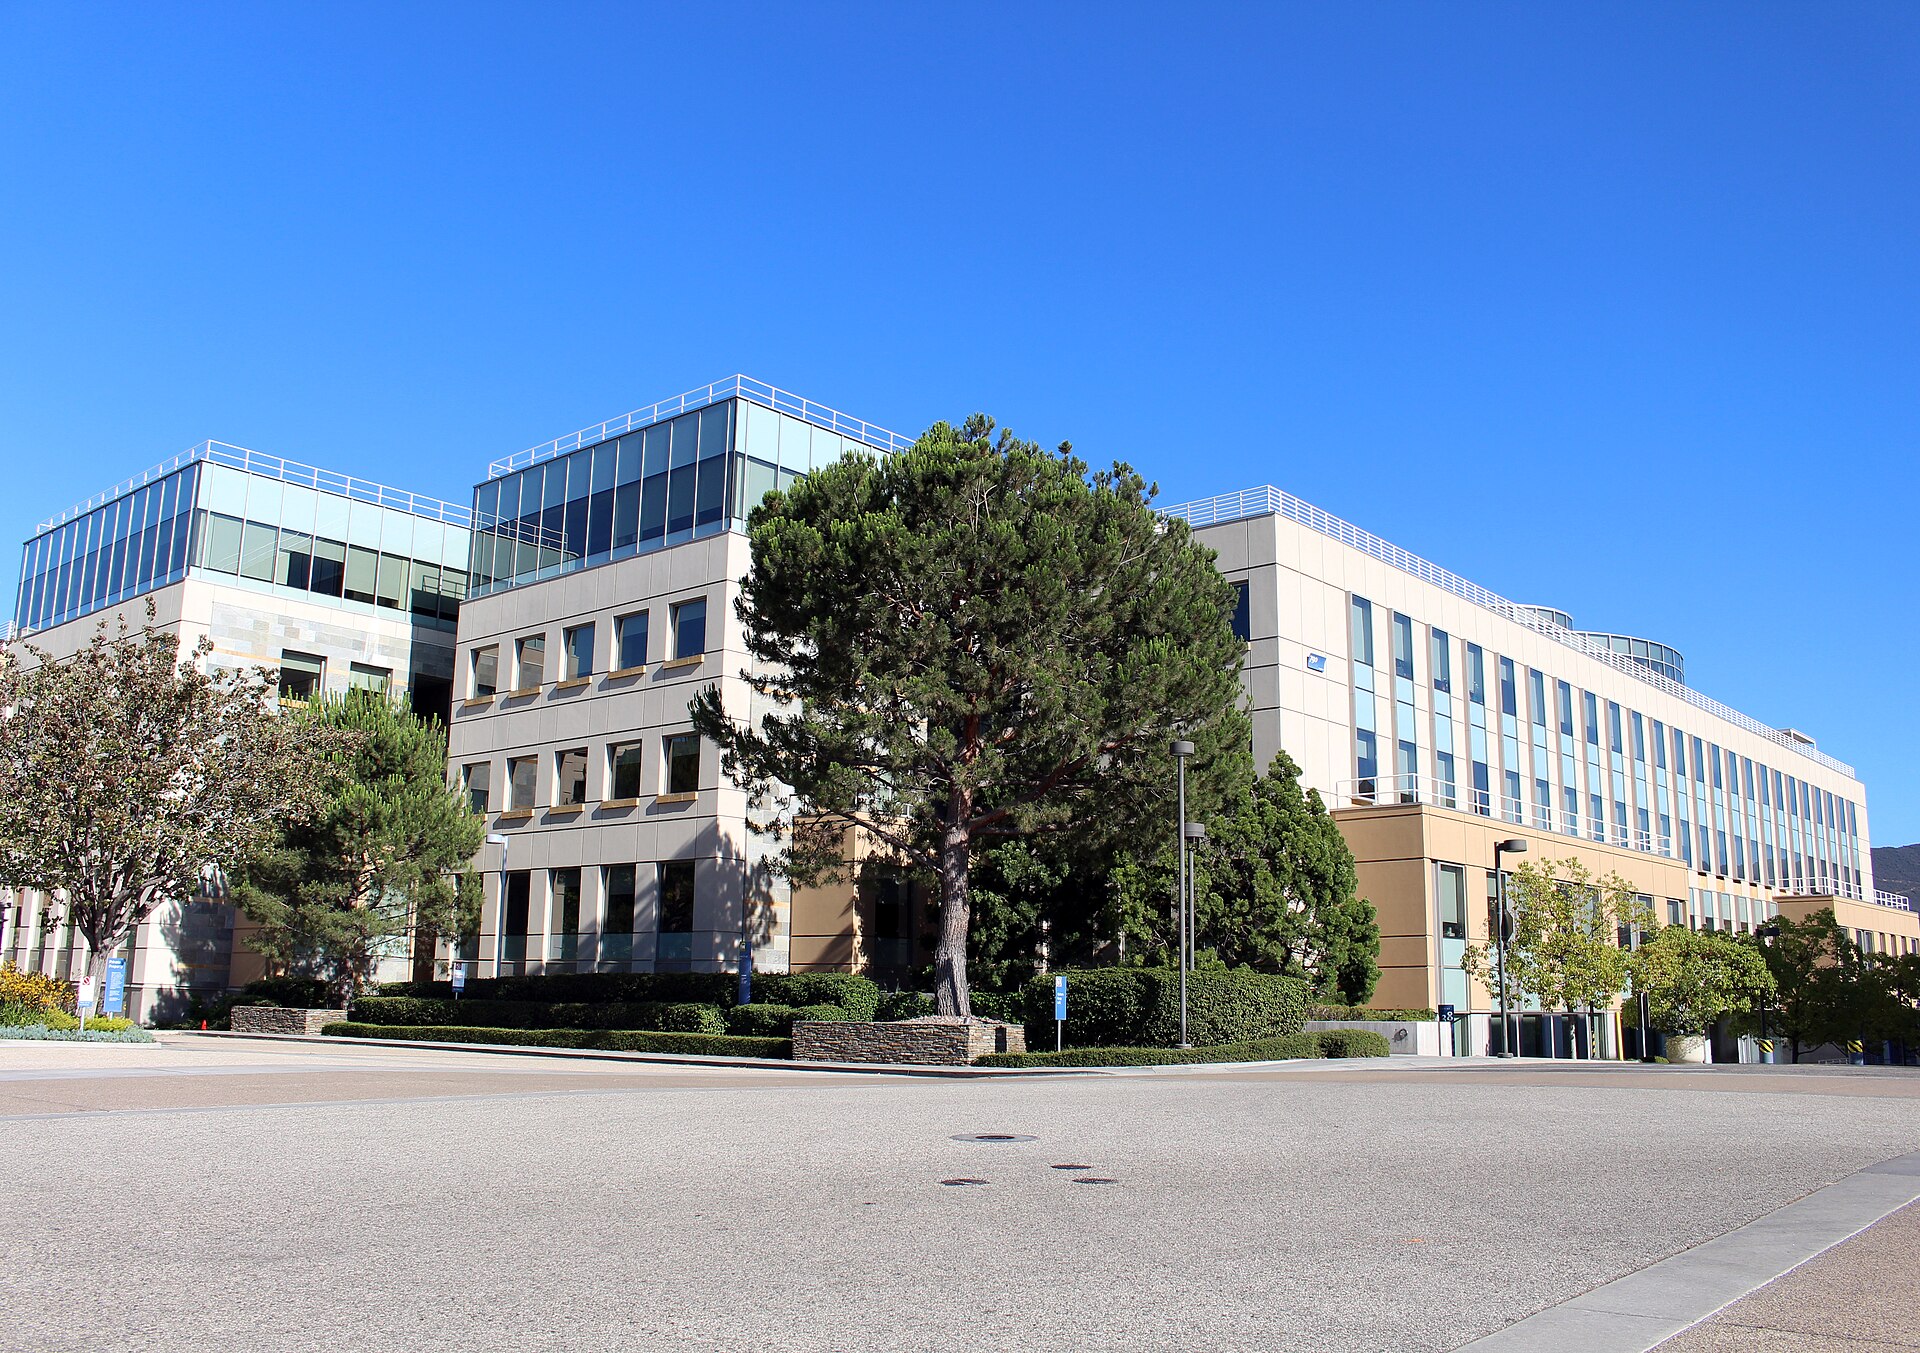
Office building on Amgen’s headquarters campus in Thousand Oaks
Archive photograph of a building at Amgen’s Thousand Oaks headquarters in California, July 2016. Illustrative company image. Photo: Coolcaesar / Wikimedia Commons · CC BY-SA 3.0 · Wikimedia-supplied thumbnail; displayed with a responsive crop.
Financials
Technicals
Earnings & peers
Earnings calendar snapshot · dates in New York time
CompanyReport dateWindowEPS estimateRevenue estimate
Amgen Inc. (AMGN)November 3, 2026Issuer confirmedAfter close5.7910.08B

1) When does Amgen report, and what is expected?

Amgen has confirmed it will report third-quarter 2026 results after close on November 3, 2026. The reporting-date announcement was issued on October 28. As of October 29, the public consensus is about $10.08 billion in revenue and $5.79 in profit per share. These are analyst forecasts, not results. The historical earnings comparisons use non-GAAP profit per share, which adjusts the reported accounting figure for specified items.

2) Can growth medicines keep lifting the outlook?

The product mix matters more than the total sales figure alone. Demand for medicines that are growing needs to offset competition and loss of patent protection elsewhere in the portfolio. Watch patient volumes, net selling prices and the expense of reaching additional customers. In August, Amgen increased its annual revenue outlook to $38.2 billion–$39.4 billion from $37.1 billion–$38.5 billion. It also raised its adjusted profit-per-share range to $22.30–$23.50 from $21.70–$23.10. The next decision is whether management can sustain that outlook as research and commercial spending continue.

3) What does the clinical update add to the earnings discussion?

On September 22, Amgen reported that dazodalibep met the main goal of a Phase 3 study in people with systemic Sjögren’s disease, an autoimmune condition. Phase 3 is late-stage testing; the result is research progress, not regulatory approval. The company said a separate Phase 3 study in patients with a high symptom burden was expected to complete in the fourth quarter of 2026. Watch the timing of detailed results and the next development steps. The commercial value depends on the full evidence, regulatory decisions and eventual access for patients.

4) How much cash can reach shareholders?

At the June 30 balance-sheet date, Amgen reported $57.3 billion of debt and $14.0 billion of cash. The earnings update should help show how growth is supporting research, investment, debt obligations and dividends. Free cash flow means operating cash left after capital investment. Its improvement in the previous quarter partly reflected the comparison with a final repatriation-tax payment made a year earlier. That makes underlying business cash generation more useful than assuming the full increase will repeat.

5) What do valuation and the completed charts show?

At the October 28 regular close of $451.83, Amgen traded at about 28.1 times trailing reported profit per share and 6.41 times trailing revenue. Those figures use results through June 30, 2026. The close was above the 20-day price average of $425.37 and the 50-day average of $418.95. The RSI momentum indicator was about 66.2 on a 0–100 scale. ATR, a measure of typical daily price range, was about $10.82. These describe the completed trend before earnings; results or trial news can move the stock beyond recent ranges.

6) How the business makes money

Amgen develops, manufactures and sells medicines across cancer, inflammatory diseases, bone health, cardiovascular disease and rare conditions. Revenue depends on patient demand, reimbursement and prices after discounts. Research creates potential future products, while established medicines help fund development and shareholder distributions.

7) What to watch

Watch volumes and net prices for growth medicines, progress against the annual outlook and cash after investment. Repatha and the broader growth portfolio are important demand checks. Dated clinical milestones, including dazodalibep and the obesity-development program, can change expectations for future sales without contributing immediate approved-product revenue.

8) Recently reported peers

Biogen reported third-quarter results before open on October 28, 2026. Revenue of $2.8041 billion and non-GAAP profit per share of $2.62 exceeded the dated forecasts of $2.63 billion and $1.99. Its adjusted figure still included $284 million of acquired research and related charges; reported profit was a loss of $0.14 per share. Biogen raised the lower end of its annual non-GAAP profit forecast to $12.20 from $12.00, leaving the $13.00 upper end unchanged. The stock nevertheless fell about 3.4% from the October 27 close to the October 28 close. Its drug mix and acquisitions differ from Amgen’s, but it illustrates why a forecast beat should be weighed alongside spending, accounting charges and the outlook.

9) Risks into the report

Competing medicines, loss of patent protection and lower net prices can erode sales even when more patients are treated. Clinical studies can fail or take longer, and positive study results do not guarantee approval or commercial success. Manufacturing demands, development costs and debt obligations can reduce the cash available to shareholders.

AI-assisted research. Earnings dates and estimates may change. Estimates are not reported results. Educational information; investing involves risk.

Explore the stocks in this report

EXPLORE COMPANY RESEARCH

Amgen: the full stock picture

Earnings history, financials, price action and peer comparisons — all below.
Open AMGN stock page ↗

EXPLORE THE COMPANY

Amgen (AMGN)

Explore earnings, price action, financials and industry comparisons.

Symbol
AMGN
Sector
Healthcare
Industry
Drug Manufacturers - General
Instrument type
EQUITY

Profile information from our saved company catalog. This is not a live quote or confirmation of current listing status.

EARNINGS & COMPANY RESEARCH

AMGN earnings, valuation & price action

View in calendar ↗
NEXT EXPECTED REPORTFeb 2 2027Time unconfirmed · ET
EPS ESTIMATE5.65
REVENUE ESTIMATE10.45B

Expected dates may change. Estimates use the source’s reporting currency. Quotes and research are snapshots, not live prices.

COMPANY RESEARCH · Healthcare

Amgen Inc. AMGN

Drug Manufacturers - General · Updated 11/9/2026

Adjusted closing price · USD465.23 Nov 9
276346417488Nov 6May 11Nov 9
Price50-day average200-day average+51.5% in view
VALUATION & EXPECTATIONS
Trailing P/E27.5×
Forward P/E20.1×
Trailing P/S6.6×
Forward P/S6.6×
EPS beat rate100%
Revenue beat rate100%
Positive window63%

EPS beats: 8 of 8 comparable reports. Positive price windows: 5 of 8.

Market caps may be up to 14 days old; prices up to seven days old; ratios and analyst estimates up to fourteen days old. Forward multiples use consensus for the fiscal year ending 2026-12-31, not the next 12 months. Negative or unavailable earnings multiples show “N/A”. Forward ADR multiples are omitted when the currency/share basis is not reconciled.

50-day average423.08
200-day average375.91
RSI (14)63
20-day range412.84 – 478.48
Relative volume0.8×
1-year change+51.5%
Last eight reported earnings for AMGN
Report dateEPS estimateEPS actualSurpriseResultRevenue actualPrice window*5 sessions*
Nov 3 20265.796.45+11.4%Beat10.37B+2.8%N/A
Aug 4 20265.626.29+11.9%Beat10.05B+7.6%+9.4%
Apr 30 20264.775.15+8.0%Beat8.62B-2.4%-2.6%
Feb 3 20264.735.29+11.8%Beat9.87B+6.2%+5.8%
Nov 4 20255.025.64+12.4%Beat9.56B+8.0%+14.2%
Aug 5 20255.286.02+14.0%Beat9.17B-5.7%-5.6%
May 1 20254.274.90+14.8%Beat8.15B-3.3%-6.5%
Feb 4 20255.045.31+5.4%Beat9.09B+6.6%+2.7%

*Adjusted close before the report date to the first (or fifth) trading close after it. This window can span two sessions and is not an isolated earnings-day return. Figures may be revised by the provider.

Smart Money activity

Recent insider and politician transactions, and disclosed fund positions for AMGN.

Get Pro to see what insiders are doing ahead of earnings.

Explore insider trades, fund holdings and politician activity with an active Pro membership.

Checking membership…

AMGN earnings previews and market catalysts

November 3 after-close earnings preview: AI margins, travel demand and insurance costs in focus
2026-11-03 · Ahead of November 3 after-close earnings, watch whether AMD and Arista turn AI demand into profitable growth, Booking sustains travel demand, and insurers contain costs. Amgen, Block and IFF add distinct business tests.

November 3 earnings preview: AMD and Arista test AI demand as travel and insurers report
2026-11-03 · AMD and Arista put AI spending in focus after close on November 3. Amgen, Booking, Block, AIG, Prudential and IFF add tests of drug growth, travel demand and financial resilience.

Top Market Events to Watch This Week (November 2–6, 2026 | U.S. Eastern Time)
2026-11-01 · Jobs data, U.S. midterm elections and business surveys shape the week, alongside Apple, AMD and other earnings. Watch how demand, costs and company guidance change the outlook for stock prices.

Amgen earnings ahead: can drug growth offset competition and fund new treatments?
2026-10-29 · Amgen reports after close on November 3. Growing medicines and a higher annual outlook support the business, while competition, research spending and clinical milestones will shape how much growth reaches shareholders.

All upcoming earnings catalysts →

02 / FINANCIALS

Amgen financials

Revenue, earnings, cash flow and financial strength in one view.

Reporting currency unconfirmed.

Revenue
Net income
Gross profit
Operating income
EBITDA
Operating cash flow
Capital expenditure
Cash
Total assets
Total liabilities
Shareholder equity
Total debt
Net profit margin
Gross margin
Short interest: days to cover
How to read these financial metrics

Figures use the app’s saved statements for the displayed period, not a trailing-year total. Margins divide profit by revenue; quick ratio uses current assets less inventory divided by current liabilities. Compare dates and currencies before comparing companies.

03 / WHAT COMES NEXT

Amgen event catalysts

Company earnings and scheduled market events that may change expectations.

2027-02-02

AMGN earnings

Watch reported results, management’s outlook and the share-price reaction.

See earnings expectations ↑
2026-11-108:30 AM ET

CPI inflation

Compare headline and core inflation with expectations; watch Treasury yields and growth stocks.

Release schedule ↗Scheduled
2026-11-11Time not announced

MSCI · index review announcement

Review official additions, deletions and weight changes; release time is not specified here.

Release schedule ↗Scheduled
2026-11-128:30 AM ET

Initial jobless claims

Use the multiweek trend to distinguish normal volatility from a sustained increase in layoffs.

Release schedule ↗Scheduled
2026-11-138:30 AM ET

PPI inflation

Watch the surprise versus expectations and implications for margins and interest rates.

Release schedule ↗Scheduled
2026-11-13Time not announced

Russell · preliminary additions/deletions

Check the official lists. Preliminary changes can be revised.

Release schedule ↗Scheduled
2026-11-16Filing deadline · ET date

13F filing deadline · Q3 holdings

Filings may arrive earlier and positions can have changed. A filing is not a new trade or a guarantee of buying pressure.

Release schedule ↗Scheduled
2026-11-178:30 AM ET

Retail sales

Look beyond autos and gasoline; stronger spending can help earnings but also keep yields elevated.

Release schedule ↗Scheduled
2026-11-179:15 AM ET

Industrial production

Check factory output and utilization for changes in cyclical demand.

Release schedule ↗Scheduled

Dates use U.S. Eastern time and can change. Calendar events provide context; they do not determine the direction of a stock move.

04 / SIDE BY SIDE

Compare AMGN with its peers

Drug Manufacturers - General · Compare valuation, financial strength and price performance.

Companies with valuation data7
Peer median positive P/E33.9×
AMGN P/E27.5×
AMGN peer comparison: valuation
CompanyPriceMarket capP/EForward P/EP/SForward P/S
AMGNAmgen2026-11-09 · USD465.23258.68B27.5×20.1×6.6×6.6×
ABBVAbbVie Inc.2026-11-09 · USD293.30510.59B49.6×21.0×7.7×7.6×
AZNAstraZeneca PLC2026-11-09 · USD189.39289.36B26.1×18.5×4.6×4.6×
BMYBristol-Myers Squibb Company2026-11-09 · USD62.14126.14B13.7×9.6×2.5×2.5×
GSKGSK plc2026-11-06 · USD50.33103.61B17.5×2.3×
JNJJohnson & Johnson2026-11-09 · USD282.11663.03B41.8×25.4×6.7×6.6×
LLYEli Lilly and Company2026-11-09 · USD1,412.221.33T45.7×40.2×15.4×14.7×
AMGN27.5×
ABBV49.6×
AZN26.1×
BMY13.7×
GSK17.5×
JNJ41.8×
LLY45.7×

The peer median excludes the selected stock and is based on 6 available positive multiples. P/E median excludes negative or missing earnings multiples. Peer reports can have different fiscal periods and currencies; values are not currency-converted.

05 / PEER ANALYSIS

Explore AMGN alongside its peers

Drug Manufacturers - General · 15 companies · Cached market data

Comparison

Compare companies

Tap a bubble to inspect a company, then × to hide it. Undo restores the last company hidden. Bubble area reflects market cap, with a minimum size for visibility.

Price / sales
0.5×06.0×491.54B11.5×983.08B17.0×1.47TLLY · Eli Lilly and Market cap: 1.33T Price / sales: 15.4×JNJ · Johnson & Johnson Market cap: 663.03B Price / sales: 6.7×ABBV · AbbVie Market cap: 510.59B Price / sales: 7.7×MRK · Merck & Market cap: 365.7B Price / sales: 5.4×NVS · Novartis AG Market cap: 305.05B Price / sales: 5.5×AZN · AstraZeneca Market cap: 289.36B Price / sales: 4.6×GILD · Gilead Sciences Market cap: 216.11B Price / sales: 7.0×NVO · Novo Nordisk A/S Market cap: 177.01B Price / sales: 3.6×PFE · Pfizer Market cap: 170.99B Price / sales: 2.7×BMY · Bristol-Myers Squibb Market cap: 126.14B Price / sales: 2.5×SNY · Sanofi Market cap: 113.74B Price / sales: 2.1×GSK · GSK plc Market cap: 103.61B Price / sales: 2.3×AMGN · Amgen Inc. Market cap: 258.68B Price / sales: 6.6×Hide AMGN · Undo restores itMarket cap
AMGNAmgen Inc.

Market cap: 258.68B
Price / sales: 6.6×

Valuation snapshot: 2026-11-09
13 of 15 companies have both plotted values.

P/S distribution

Trailing price-to-sales multiples · 13 companies

Median P/S5.4×
Middle 50%2.7× to 6.7×
AMGN P/S6.6×
AMGN
1.9×8.1×

Tap a bar to see the companies in that P/S range. AMGN has a higher P/S than 62% of this group.

2 companies excluded from P/S statistics because sales are non-positive or the saved multiple is missing. Statistics include all valid positive values, including those outside the focused chart range.

Companies

Showing 8 of 15 matching companies · Largest market cap first

  • Market cap 1.33TP/E 45.7×P/S 15.4×Forward P/E Forward P/S Price snapshot: 2026-11-09
    ↗
  • Market cap 663.03BP/E 41.8×P/S 6.7×Forward P/E Forward P/S Price snapshot: 2026-11-09
    ↗
  • Market cap 510.59BP/E 49.6×P/S 7.7×Forward P/E Forward P/S Price snapshot: 2026-11-09
    ↗
  • Market cap 365.7BP/E 151.3×P/S 5.4×Forward P/E Forward P/S Price snapshot: 2026-11-09
    ↗
  • Market cap 305.05BP/E 30.9×P/S 5.5×Forward P/E Forward P/S Price snapshot: 2026-11-09
    ↗
  • Market cap 289.36BP/E 26.1×P/S 4.6×Forward P/E Forward P/S Price snapshot: 2026-11-09
    ↗
  • Market cap 258.68BP/E 27.5×P/S 6.6×Forward P/E Forward P/S Price snapshot: 2026-11-09
    ↗
  • Market cap 216.11BP/E P/S 7.0×Forward P/E Forward P/S Price snapshot: 2026-11-06
    ↗

Explore industries

Open an industry for its comparison, valuation and companies.

U.S.-listed companies from the app’s catalog. Medians use saved positive P/E values; coverage and snapshot dates vary.

How this comparison works

Uses the saved companies from the same industry and listing market, including AMGN, ordered by cached market cap. Company snapshots can have different dates; the web cache may cover fewer metrics and periods than the app.

Periods end at each company’s dated price snapshot. Change compares the latest saved observation with one at or before the selected period’s start. A daily price change uses consecutive saved sessions. Financial data updates quarterly, so short periods may show no change. Missing history and zero starting values are excluded; a negative starting value uses its absolute value as the denominator.

Metrics use saved ratios and percentages. Market caps use the listing market’s reporting currency; underlying financial statements may use different currencies. Circle sizes have a minimum for touch visibility, and an outlined circle indicates a missing market cap. These comparisons describe data, not recommendations or price predictions.

INDUSTRY COMPARISON

AMGN industry peers

Drug Manufacturers - General · Oct 16, 2026 · Closing-price performance

Compare AMGN with 7 other stocks in the available heatmap coverage.