Why Netflix, Inc. (NFLX) Stock Is Down Today
Delayed snapshot
“Today” refers to the Oct 26, 2026 U.S. market session.

What is behind the stock move?
Huatai Financial lowered Netflix from Buy to Hold on October 25, ahead of Monday’s further decline. Netflix’s October 20 results had reduced its annual advertising outlook from roughly $3 billion to $2.7 billion as new ad capabilities rolled out more slowly. The investment question is whether subscriptions and better ad execution can sustain growth as the business expands. The downgrade is analyst opinion, while the advertising revision is management guidance from last week.
Latest company research
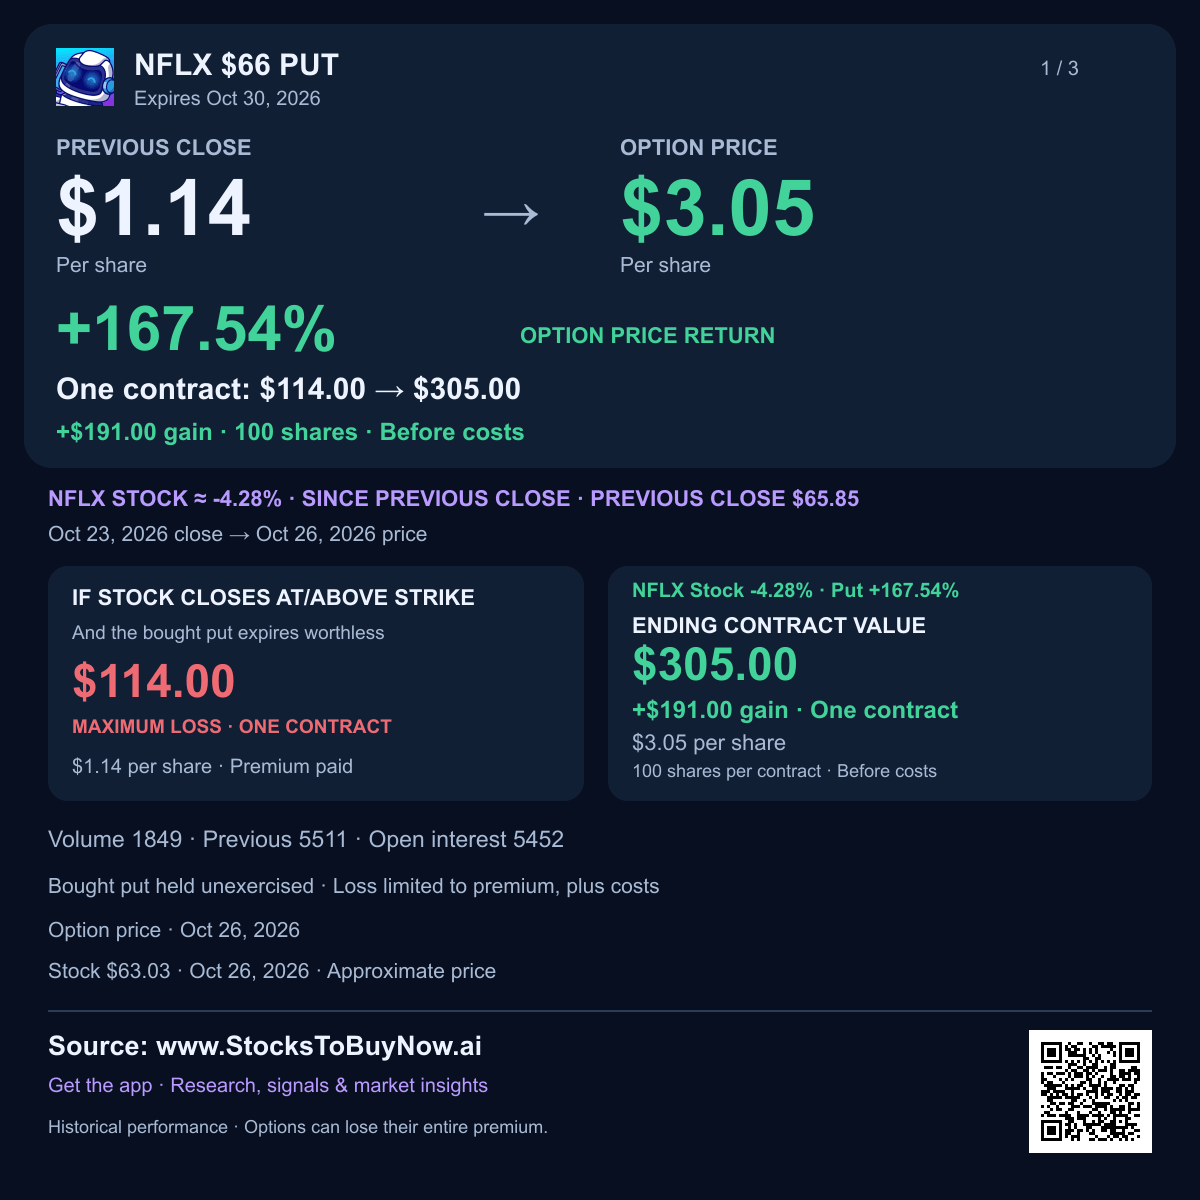
Netflix fell 4.16% to $63.11 during trading on October 26, 2026, following a weekend Huatai downgrade as its reduced advertising outlook weighed on the growth story.
- Huatai Financial cut Netflix from Buy to Hold on October 25. That adds to the reassessment of the stock after the October 20 earnings report.
- Netflix lowered its 2026 advertising forecast to about $2.7 billion from $3 billion because new ad features are taking longer to roll out. The roughly 10% cut weakens an important source of future growth.
- The subscription business is still growing. September-quarter revenue rose 12% to $12.87 billion, while GAAP earnings per share, meaning profit per share, reached $0.87.
- Netflix expects $13.44 billion of fourth-quarter revenue and a 26% operating margin. Planned job cuts reduce that margin by about 1.2 percentage points through restructuring costs.
- Cash deserves attention alongside profit: the 2026 free-cash-flow forecast fell to about $12 billion from $12.5 billion, mainly because of a planned property transaction.
- The completed October 23 chart closed at $65.85 below its 20-day and 50-day averages. Monday’s price has since fallen below the $64.10 low reached after earnings.
Watch whether delayed ad features launch and the holiday content slate supports viewing and subscriptions. A recovery above the recent $67.10–67.80 rebound area would improve the chart; continued trading below $64.10 keeps pressure on the shares.
Financials and technicals
Charts through Oct 23, 2026. The session move above may reflect later news.
Technical setup and risks
October 23 completed chart: close $65.85, 20-day average $69.15 and 50-day average $74.27. October 26 trading has broken below the October 21 low near $64.10. A recovery through $67.10–67.80 would reclaim recent rebound highs. These levels are conditional reference points; competition and ad-product execution remain risks.
AI-assisted research with source and calculation checks. Prices may be delayed. Technical charts use the stated completed session, which can precede the quoted intraday move. Educational information; investing involves risk.