NDAQ · EARNINGS RESULTS · 2026-10-22
Why Nasdaq (NDAQ) Stock Is Up Today: Q3 2026 Earnings
$102.43 · Snapshot as of
Earnings and the stock move
Nasdaq advanced in the session following its October 22 third-quarter release. Growth in recurring revenue, indexes and financial technology provides earnings context for investors assessing the move; trading activity can also reflect broader market factors.
Q3 2026 earnings recap
Nasdaq reported Q3 net revenue of $1.481 billion, up 13% year over year and 14% organically.
- Solutions revenue increased 17% to $1.172 billion, or 18% organically.
- Annualized recurring revenue reached $3.365 billion, up 12%, supporting revenue visibility.
- Financial Technology revenue rose 16% to $529 million.
- Index revenue jumped 39% to $286 million, with $49 billion of net inflows during the quarter.
- GAAP diluted EPS increased 31% to $0.96; adjusted EPS rose 18% to $1.04.
- GAAP operating income grew 25% to $732 million; adjusted operating income increased 15% to $843 million.
Nasdaq returned $496 million to shareholders through $173 million in dividends and $323 million in share repurchases.
Financials and technicals
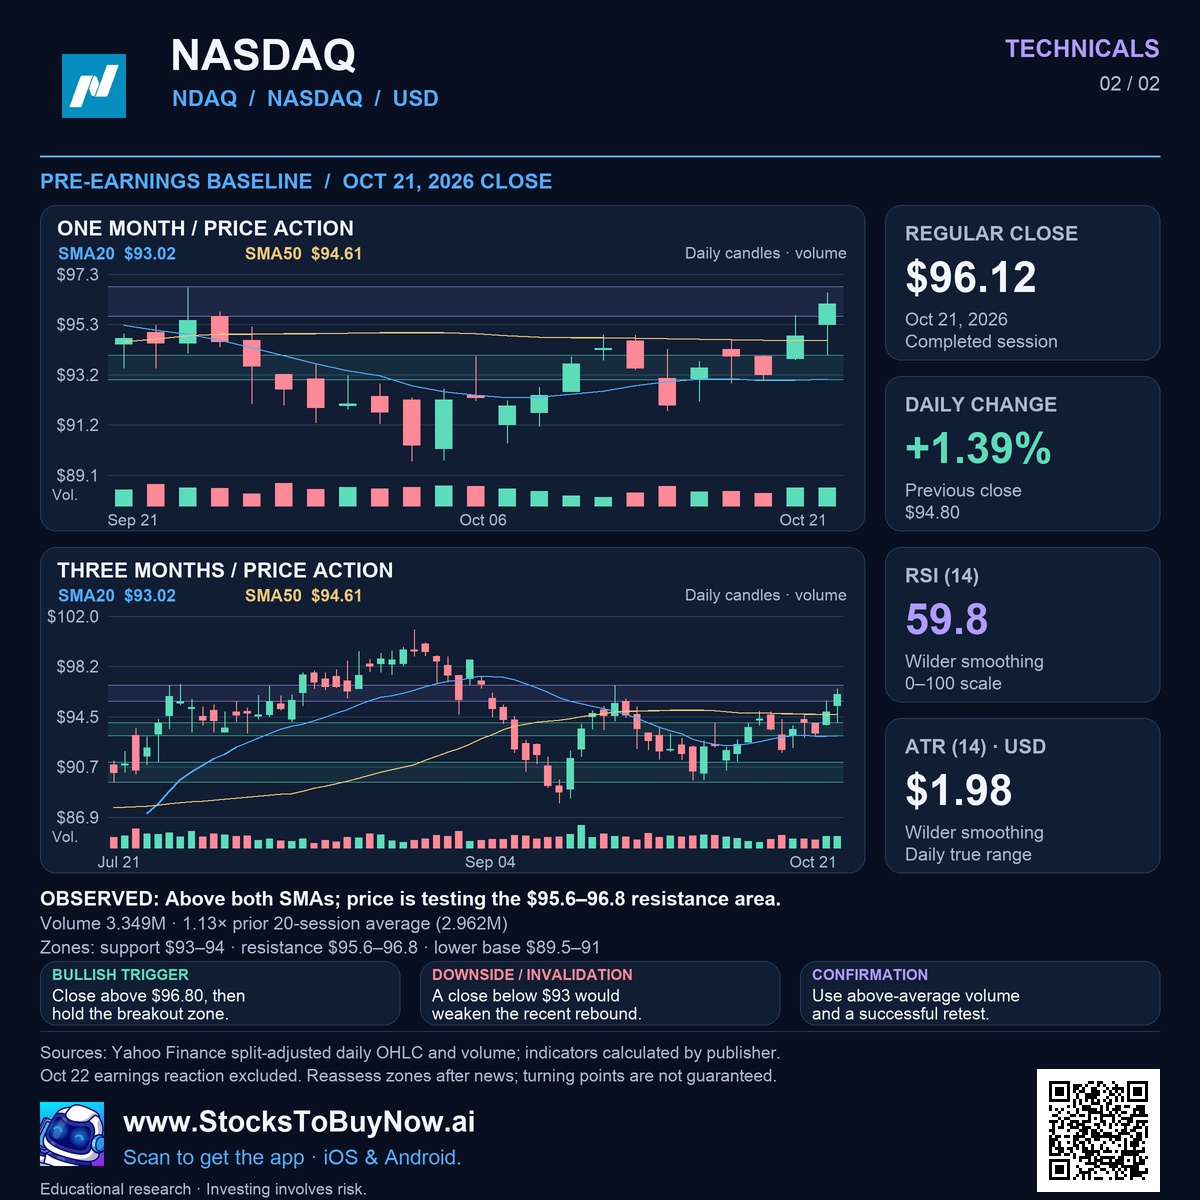
Technical charts use the October 21, 2026 completed close. The intraday move above may reflect news released after that close.
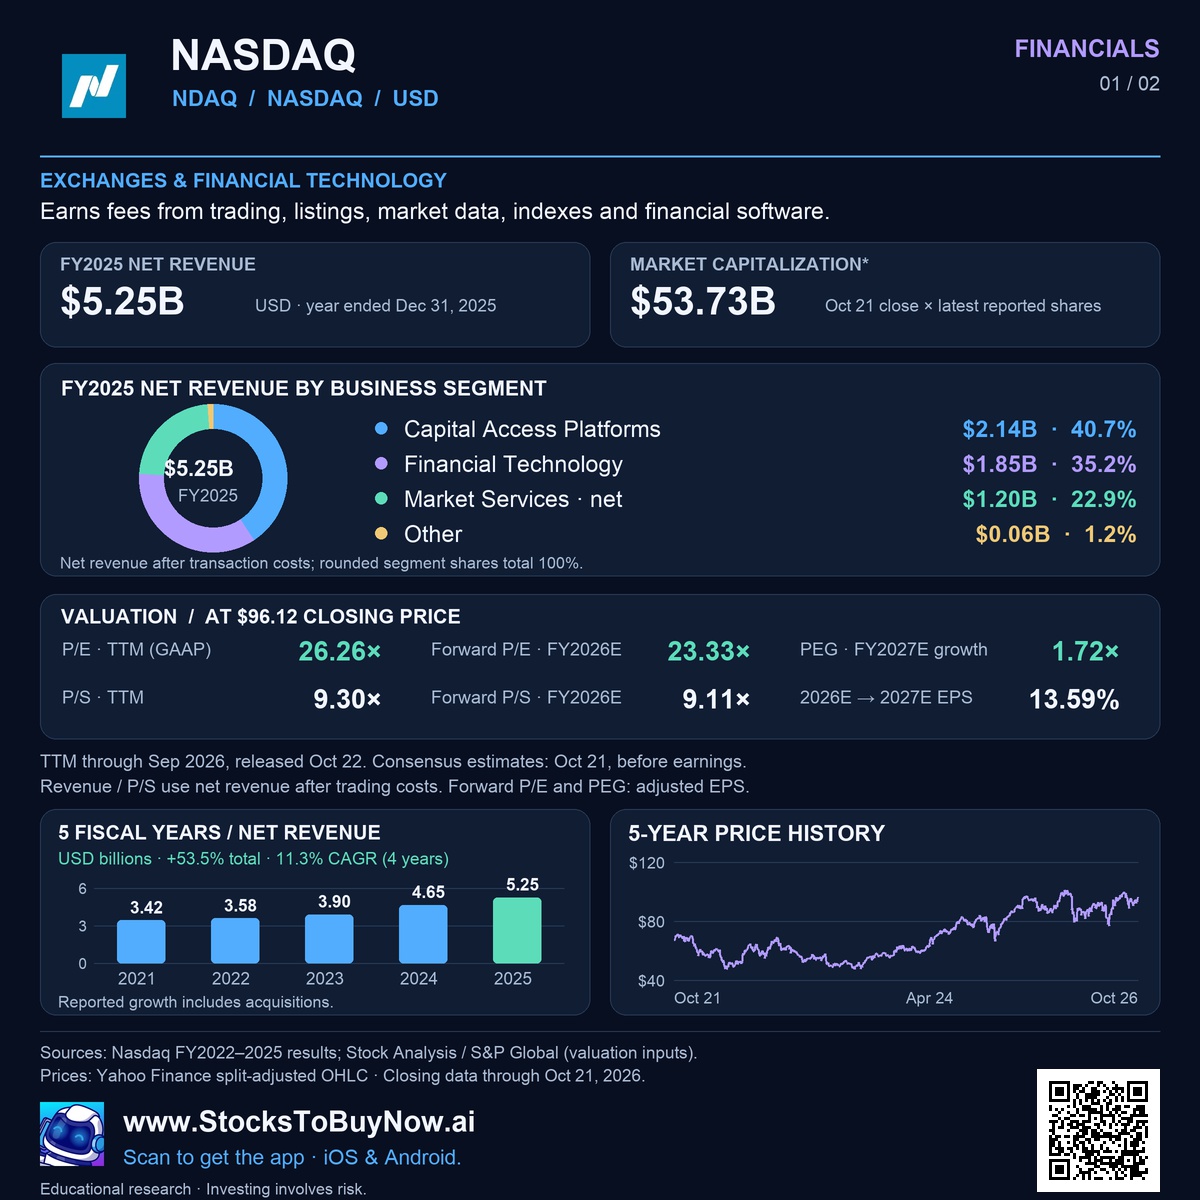
Financials
Technicals
Nasdaq (NDAQ) stock information
Earns fees from trading, listings, market data, indexes and financial software.
EXCHANGES & FINANCIAL TECHNOLOGY. Financial and valuation snapshot at the 2026-10-21 completed close; estimates and reporting dates are shown in the financial infographic.
- Completed close · 2026-10-21
- $96.12
- Indicative market capitalization
- $53.73 billion
- FY2025 revenue
- $5.25 billion
- P/E · TTM GAAP
- 26.26×
- Forward P/E · FY2026E
- 23.33×
- RSI (14) · 2026-10-21
- 59.8
Explore Nasdaq stock financials, earnings and research →
Technical setup and risks
Above both SMAs; price is testing the $95.6–96.8 resistance area. Zones: support $93–94 · resistance $95.6–96.8. Close above $96.80, then hold the breakout zone. A close below $93 would weaken the recent rebound. Use above-average volume and a successful retest. These pre-October-22 levels are conditional observations and may need reassessment after today’s news.
Research references
- Issuer filing / earnings release — ir.nasdaq.com
- Issuer filing / earnings release — ir.nasdaq.com
- Financial data and estimates — stockanalysis.com
Follow the research in the app
Open this report and follow the discussion.
Open NDAQ research in the app →