LEN · MARKET MOVERS · 2026-10-22
Why Lennar (LEN) Stock Is Up Today
$83.37 · Snapshot as of
What is behind the stock move?
Lennar rose in the October 22 market snapshot. A single same-day company catalyst has not been independently confirmed for this report. Its September earnings provide business context, rather than proof of what caused today’s move.
Latest company research
Lennar reported fiscal Q3 2026 results on September 16, covering the quarter ended August 31.
- Revenue totaled $8.05 billion, with 20,840 home deliveries, down 3% year over year.
- GAAP earnings fell to $284 million, or $1.19 per share, versus $591 million and $2.29 a year earlier.
- Adjusted EPS was $1.23, compared with $2.00 a year earlier.
- New orders declined 9% to 20,879 homes; backlog stood at 16,857 homes worth $6.3 billion.
- Home-sales gross margin was 15.8%, reflecting pressure from affordability challenges and incentives.
- Construction costs per square foot declined 6% year over year, while cycle time improved to 116 days.
Lennar repurchased $256 million of shares, but management said housing conditions had deteriorated.
Financials and technicals
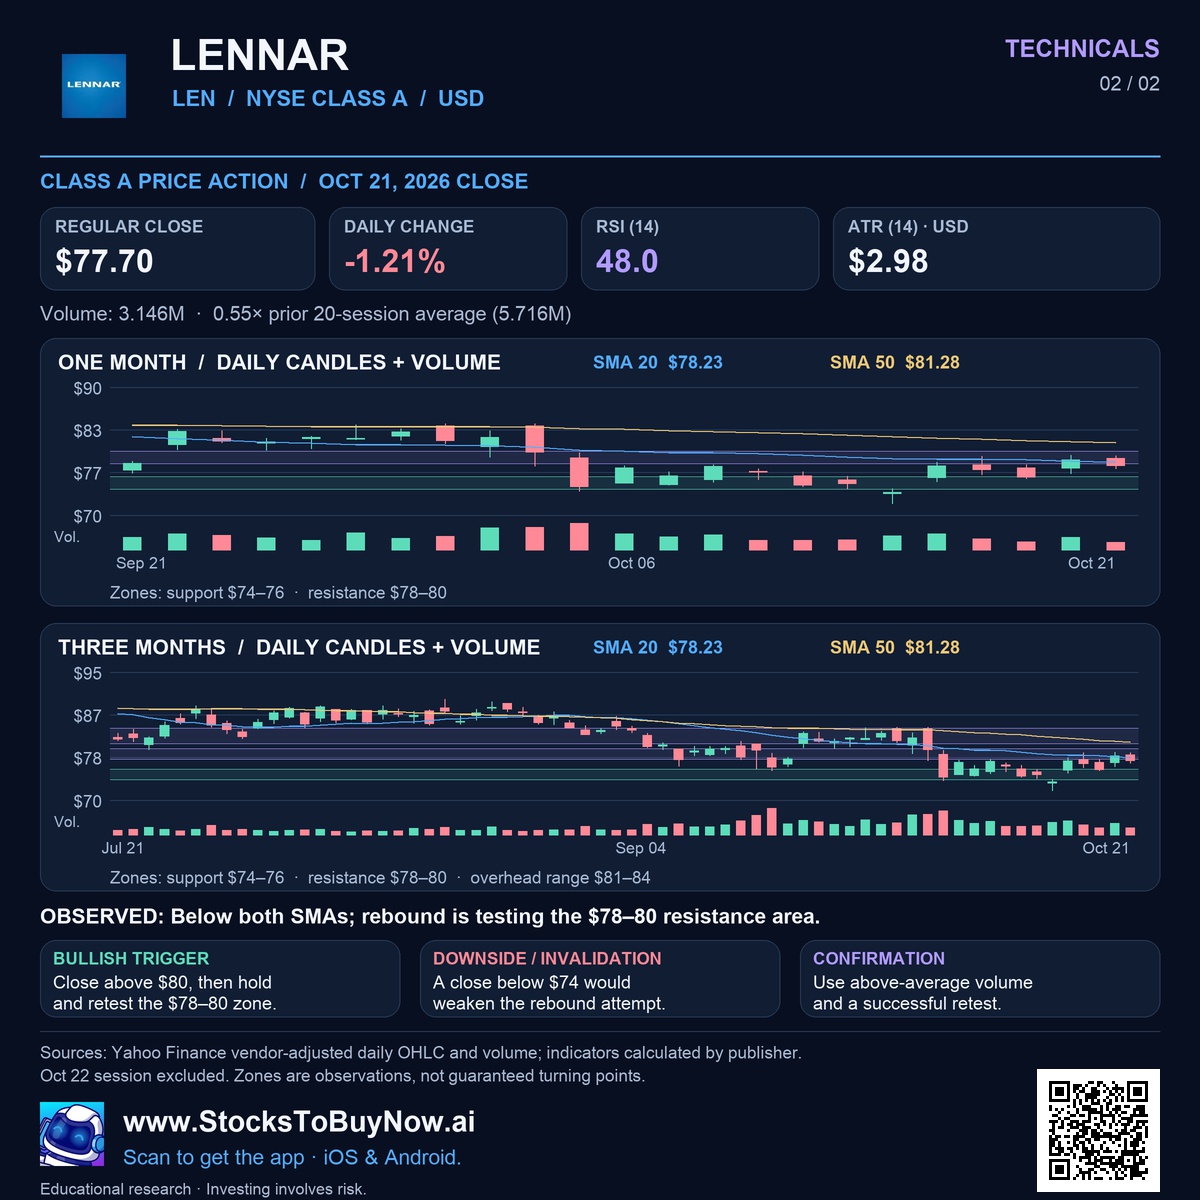
Technical charts use the October 21, 2026 completed close. The intraday move above may reflect news released after that close.
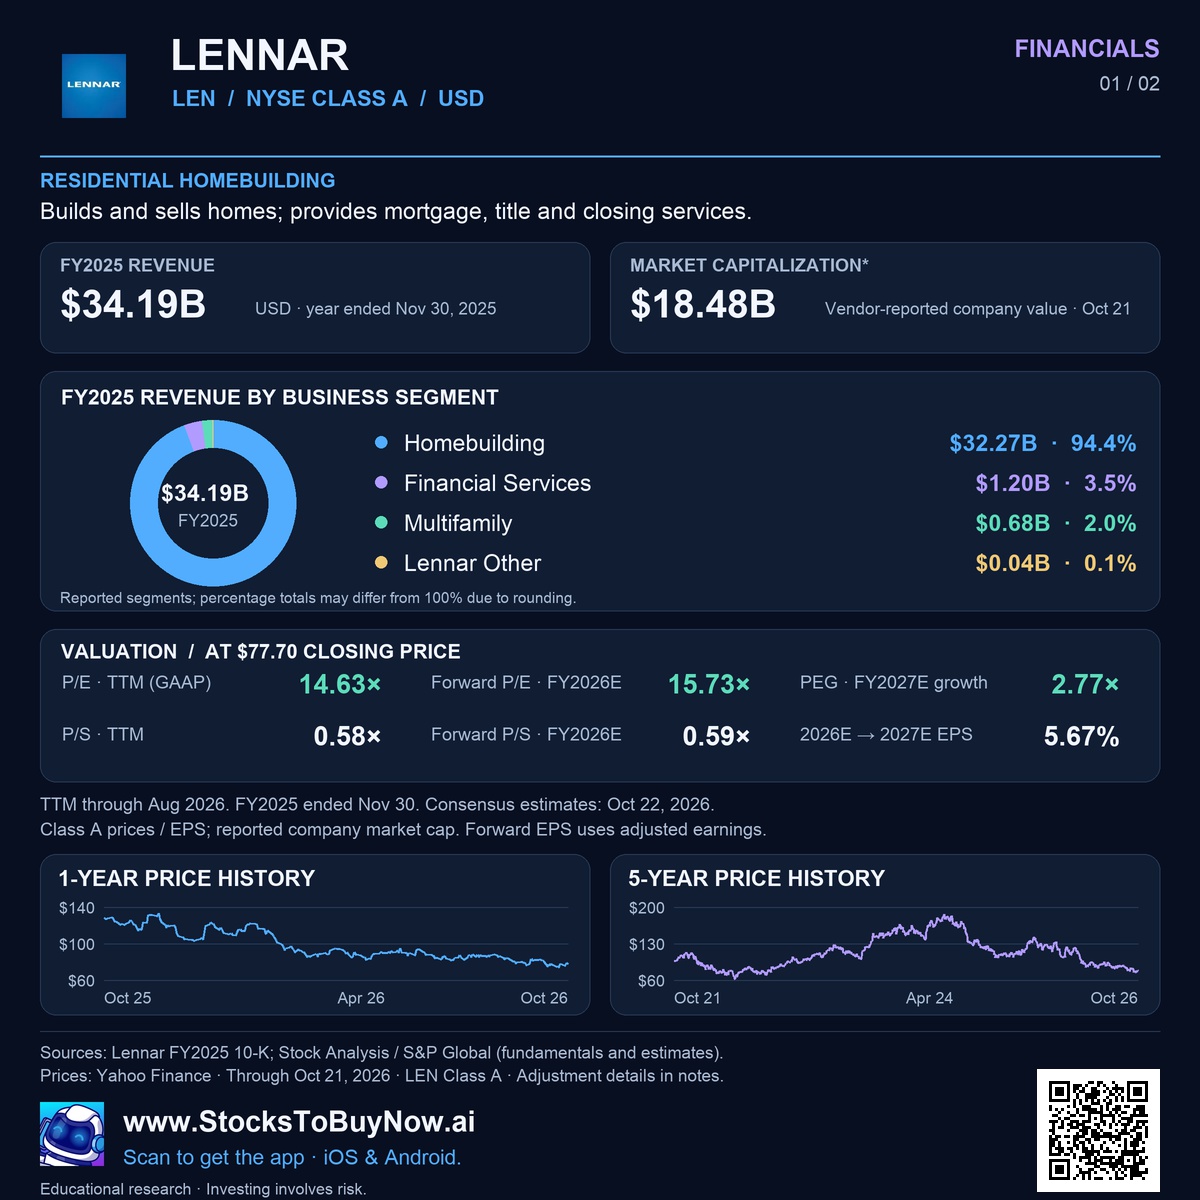
Financials
Technicals
Lennar (LEN) stock information
Builds and sells homes; provides mortgage, title and closing services.
RESIDENTIAL HOMEBUILDING. Financial and valuation snapshot at the 2026-10-21 completed close; estimates and reporting dates are shown in the financial infographic.
- Completed close · 2026-10-21
- $77.70
- Indicative market capitalization
- $18.48 billion
- FY2025 revenue
- $34.19 billion
- P/E · TTM GAAP
- 14.63×
- Forward P/E · FY2026E
- 15.73×
- RSI (14) · 2026-10-21
- 48.0
Explore Lennar stock financials, earnings and research →
Technical setup and risks
Below both SMAs; rebound is testing the $78–80 resistance area. Zones: support $74–76 · resistance $78–80. Close above $80, then hold and retest the $78–80 zone. A close below $74 would weaken the rebound attempt. Use above-average volume and a successful retest. These pre-October-22 levels are conditional observations and may need reassessment after today’s news.
Research references
- Issuer filing / earnings release — www.sec.gov
- Issuer filing / earnings release — www.sec.gov
- Financial data and estimates — stockanalysis.com
Follow the research in the app
Open this report and follow the discussion.
Open LEN research in the app →