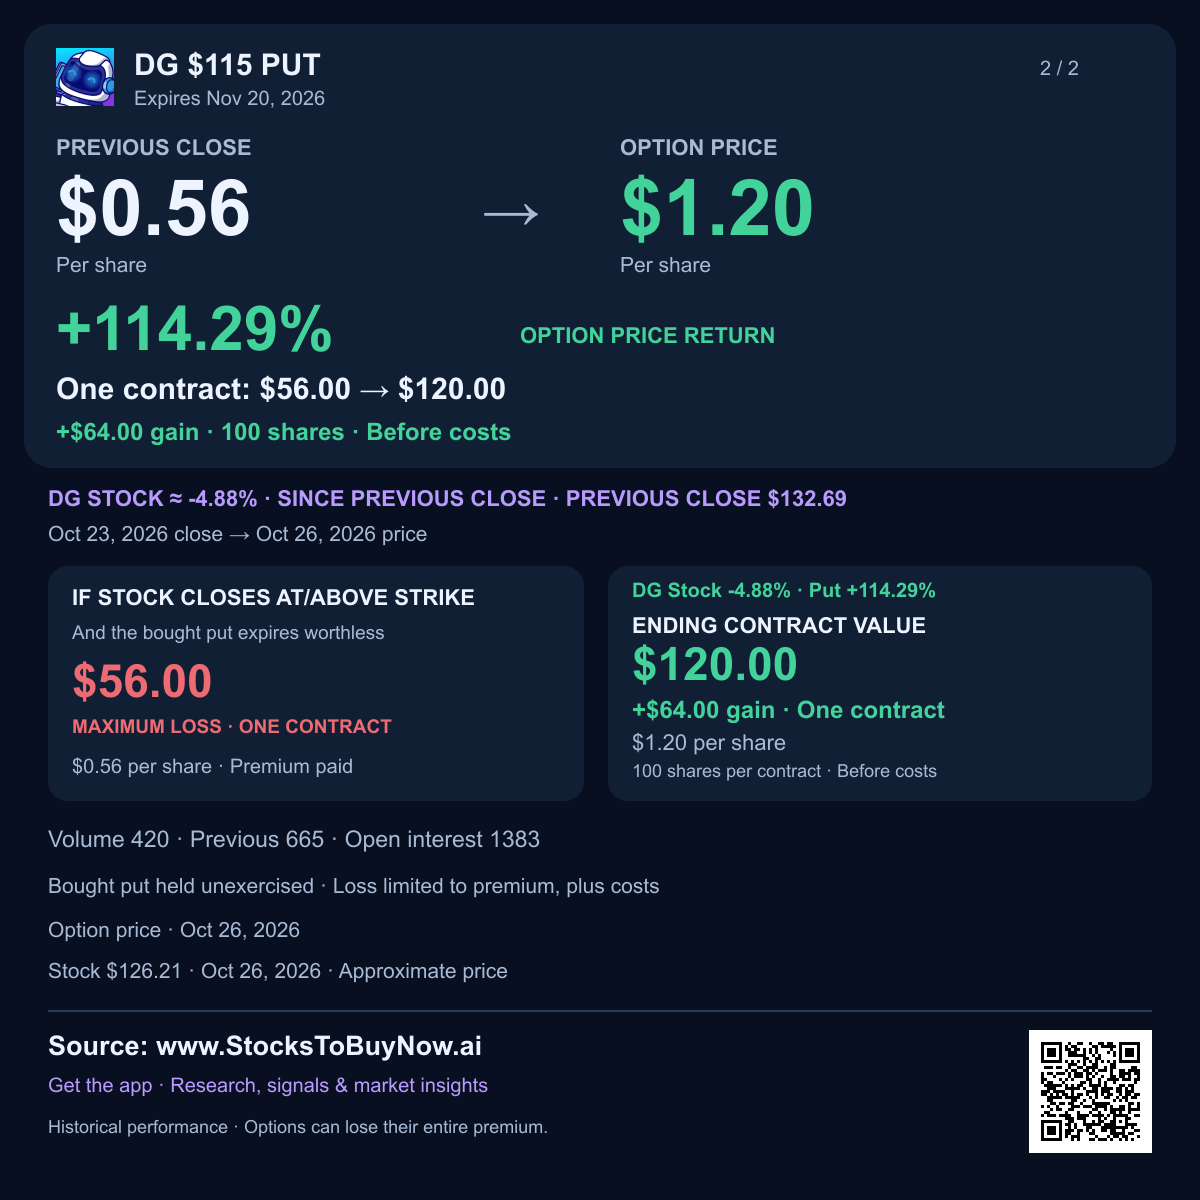
Why Dollar General Corporation (DG) Stock Is Down Today
Delayed snapshot
“Today” refers to the Oct 26, 2026 U.S. market session.

What is behind the stock move?
The FTC and 20 states filed a federal pricing lawsuit on October 26, alleging repeated checkout overcharges despite management knowledge. The complaint seeks an injunction, monetary relief and state penalties. The case remains pending. Potential compliance costs and customer-trust damage are investment risks, rather than a quantified loss forecast. The filing adds a new risk to the sales and profit recovery shown in the July quarter.
Latest company research
Dollar General fell 4.84% to $126.27 during trading on October 26, 2026, as the FTC and 20 states sued over alleged overcharging at checkout.
- The complaint says shoppers repeatedly paid more than shelf or advertised prices. The case is pending; the allegations have not been decided by a court.
- For investors, the risk extends beyond possible penalties. Better pricing controls and customer refunds could add costs, while damaged trust could hurt repeat shopping.
- This challenges a business built on affordable everyday goods: consumables accounted for about 82% of fiscal 2025 sales. Reliable prices are central to that promise.
- The underlying business had improved before this news. In the July quarter, sales at stores open at least a year rose 3.5%, including a 2% increase in customer visits.
- July-quarter GAAP earnings per share, meaning profit per share, were $2.48. About $0.25 came from tariff refunds after related reinvestment, so that benefit should not be treated as recurring growth.
- Monday’s price is below the October 23 close of $132.69 and near the earlier $124–128 trading area. A recovery through $132–134 would help repair the chart; a close below $124 would weaken it.
Watch Dollar General’s response and any court orders or settlement terms for the cost of fixing pricing controls. The next business update will also show whether stronger customer traffic can continue.
Financials and technicals
Charts through Oct 23, 2026. The session move above may reflect later news.
Technical setup and risks
The October 23 chart closed at $132.69 after reversing from $139.08. Monday’s $126.27 price returns toward the October 9–14 area around $124–128. Reclaiming $132–134 would help repair the decline; a close below $124 would weaken the advance. These are approximate areas from prior trading.
AI-assisted research with source and calculation checks. Prices may be delayed. Technical charts use the stated completed session, which can precede the quoted intraday move. Educational information; investing involves risk.