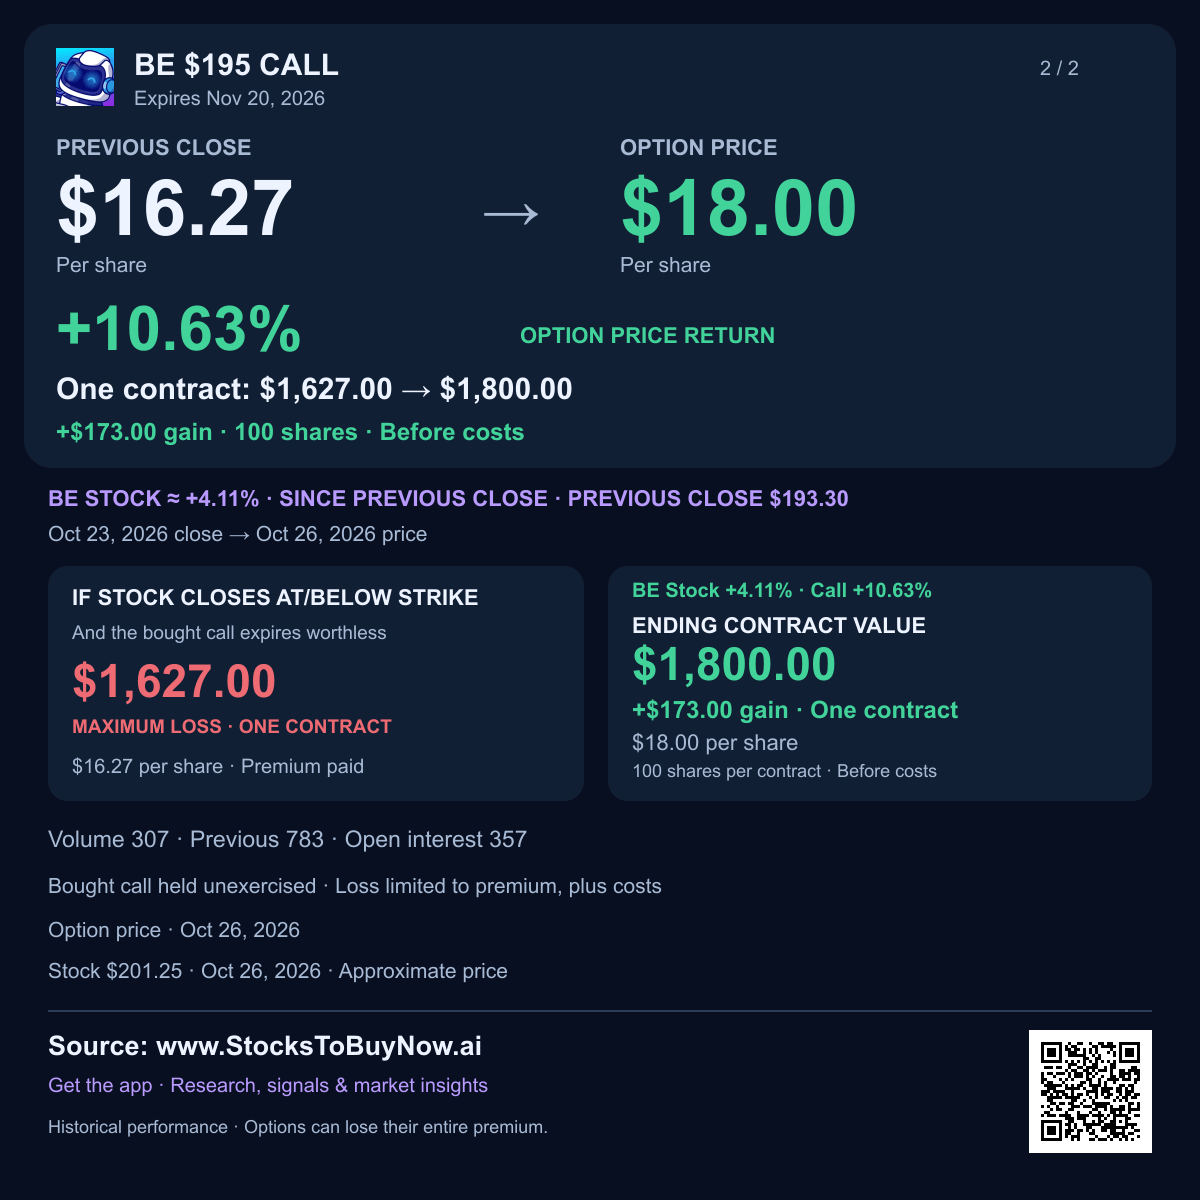
Why Bloom Energy (BE) Stock Is Up Today: Q3 2026 Earnings
Delayed snapshot
“Today” refers to the Oct 26, 2026 U.S. market session.
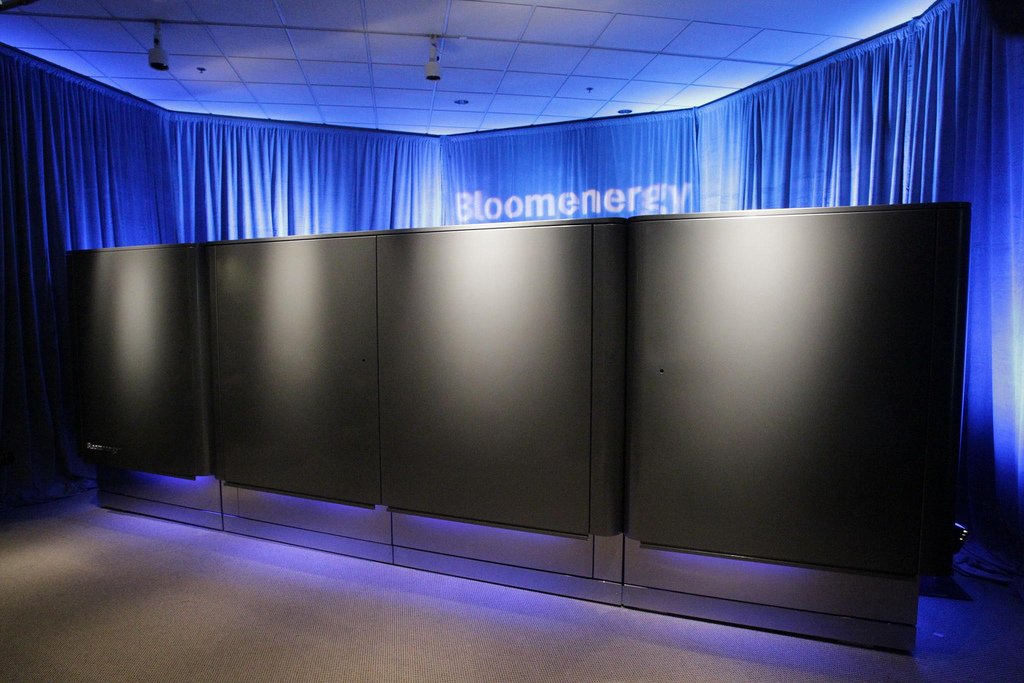
Earnings and the stock move
Bloom rebounded on October 26 as Barclays raised its price target to $316 from $308, keeping Equal Weight. The move follows Friday’s post-results selloff. The October22 report showed strong sales growth and a higher annual outlook, while cash outflows and manufacturing investment remain the central investment debate. The analyst target is an opinion, not a promised future price; those earnings were released October22, not today.
Q3 2026 earnings recap
Bloom Energy rebounded 7.58% to $207.96 during trading on October 26, 2026, alongside a Barclays price-target increase. Investors are weighing rapid power-system growth against the cash needed to fund it.
- Barclays raised its target to $316 from $308 while keeping an Equal Weight rating. The rebound follows Friday’s 11.24% decline, showing that views on the company remain divided.
- Results released after close on October 22 showed third-quarter revenue of $1.24 billion, up 138% from a year earlier. Fuel-cell systems supply electricity at customer sites, including power-hungry data centers.
- GAAP earnings per share, meaning profit per share, were $0.78; adjusted profit was $0.94 per share. The higher sales also lifted the company’s gross profit margin to 33.8%.
- Management raised its 2026 revenue outlook to $4.4–4.6 billion. Meeting that outlook requires Bloom to manufacture, deliver and commission systems without costly delays.
- Cash is the main test: operating cash flow was negative $27.1 million in the quarter, and equipment investment pushed free cash flow to negative $180.6 million. Recorded sales must turn into customer payments.
- The completed October 23 chart closed at $193.30 after touching $189. Monday’s rebound has moved above Friday’s range, but the recent $215–230 area remains overhead.
Watch whether customer collections catch up with growth and whether the stock can reclaim $215–230. A close below Friday’s $189 low would weaken the recovery.
Financials and technicals
Charts through Oct 23, 2026. The session move above may reflect later news.
Technical setup and risks
The completed October 23 chart has RSI 33.1 and ATR $20.28. Friday’s $189 low and $193.30 close define nearby support around $189–195. Monday’s rebound is above Friday’s $206 high, but recovering the October20–22 trading area near $215–230 would be stronger confirmation. A close below $189 would weaken the setup.
AI-assisted research with source and calculation checks. Prices may be delayed. Technical charts use the stated completed session, which can precede the quoted intraday move. Educational information; investing involves risk.