BX · EARNINGS RESULTS · 2026-10-22
Why Blackstone (BX) Stock Is Up Today: Q3 2026 Earnings
$116.74 · Snapshot as of
Earnings and the stock move
Blackstone shares rose in the October 22 regular-session snapshot following its Q3 2026 earnings release. The update showed higher fee-related earnings and assets under management, alongside lower distributable earnings and net realizations. These results provide earnings context for the move; attributing the entire price reaction to any one line item would be an inference. GAAP revenue, segment revenue and distributable earnings use different definitions and should not be compared interchangeably.
Q3 2026 earnings recap
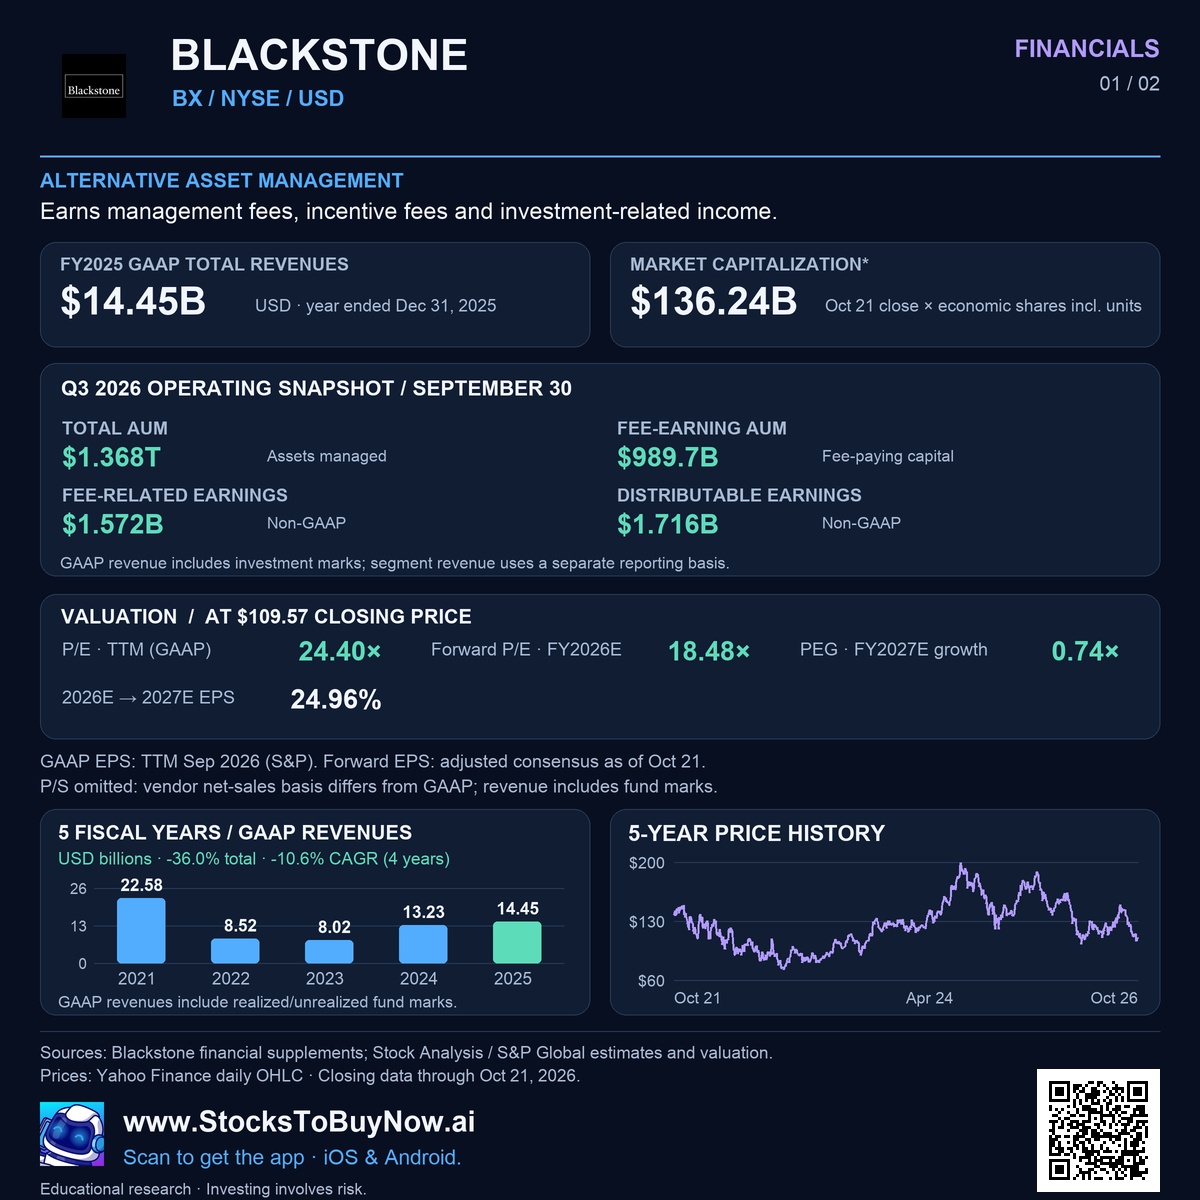
Blackstone’s Q3 fee-related earnings increased 6% to $1.572 billion, while distributable earnings declined 9% to $1.716 billion.
- Total assets under management reached $1.368 trillion, up about 10% from a year earlier.
- Fee-earning assets under management increased about 9% to $989.7 billion.
- Quarterly inflows were $63.3 billion, while capital deployed totaled $30.1 billion and realizations reached $33.1 billion.
- Management and advisory fees on a segment basis rose about 6% to $2.159 billion.
- Net realizations fell about 34% to $331.5 million, weighing on distributable earnings despite higher recurring fees.
- GAAP revenue was $3.063 billion, slightly below the prior year; net income attributable to Blackstone rose about 6% to $662.4 million.
Fundraising, fee growth and the pace of exits remain key; stronger fee earnings do not guarantee stronger distributable earnings every quarter.
Financials and technicals
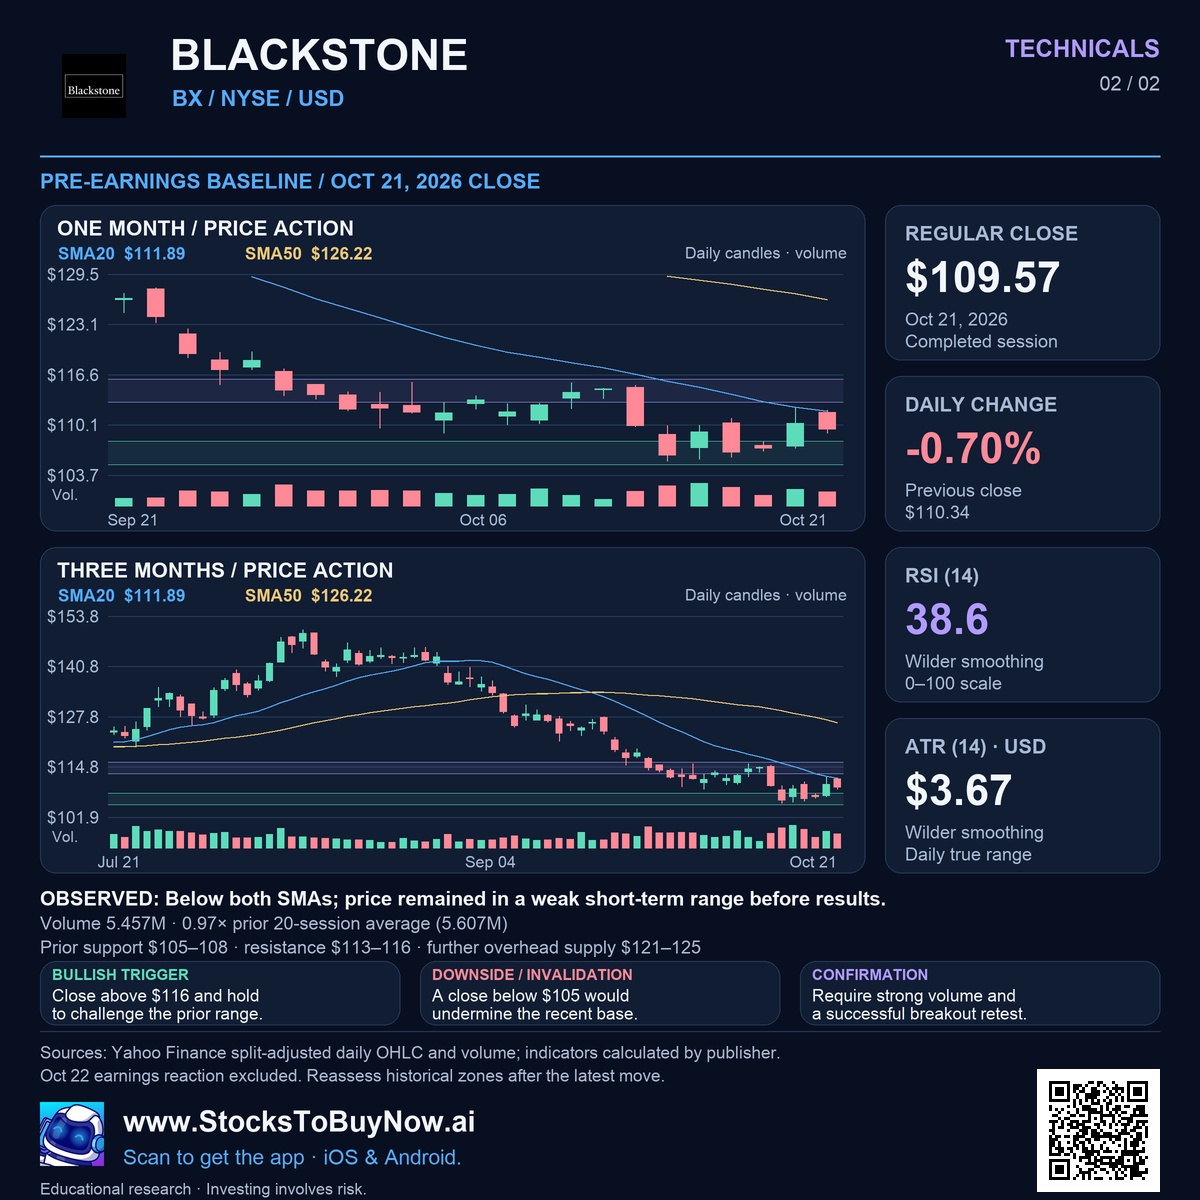
Technical charts use the 2026-10-21 completed close. The intraday move above may reflect news released after that close.
Financials
Technicals
Blackstone (BX) stock information
Earns management fees, incentive fees and investment-related income.
ALTERNATIVE ASSET MANAGEMENT. Financial and valuation snapshot at the 2026-10-21 completed close; estimates and reporting dates are shown in the financial infographic.
- Completed close · 2026-10-21
- $109.57
- Indicative market capitalization
- $136.24 billion
- FY2025 revenue
- $14.45 billion
- P/E · TTM GAAP
- 24.40×
- Forward P/E · FY2026E
- 18.48×
- RSI (14) · 2026-10-21
- 38.6
Explore Blackstone stock financials, earnings and research →
Technical setup and risks
Conditional recovery: a close above $116 and a successful retest would improve the short-term structure, with prior $121–125 trading acting as further overhead supply. A close below $105 would undermine the recent base. Levels come from completed daily bars through October 21; the October 22 earnings reaction is excluded from the charts. Confirm with volume rather than assuming the intraday move will persist.
Research references
- Financial data and estimates — www.marketscreener.com
- Financial data and estimates — www.blackstone.com
- Financial data and estimates — www.blackstone.com
- Financial data and estimates — stockanalysis.com
- Financial data and estimates — stockanalysis.com
- Financial data and estimates — query2.finance.yahoo.com
Follow the research in the app
Open this report and follow the discussion.
Open BX research in the app →