TTMI insider signal: 2 reporting investors
TTM Technologies, Inc. (TTMI): 2 distinct insiders, 3 supporting records; latest filing 2026-10-28. Financials and technicals use the dated research snapshot.
These are newly observed filings, not necessarily trades made today. How to read the dates and figures →
Financials & technicals
The disclosure signal
2 different insiders reported purchases in disclosures filed within 30 days. Review the transaction dates and original filings. The covered purchase records total 15,000 reported shares and approximately USD 1,342,810.5 calculated from reported shares and prices. Weighted-average prices and rounding mean this is an estimate. This is a disclosure-research flag, not a forecast or an instruction to buy.
Who reported the activity
Ali Wajid (director) reported a purchase in TTMI. Reported shares: 5,000; reported transaction value: $453,175. Transaction date: 2026-10-28; filed 2026-10-28. Security: Common Stock. Reported classification: P-Purchase.
Roks Edwin (director, officer: President and CEO) reported a purchase in TTMI. Reported shares: 5,000; reported transaction value: $440,350. Transaction date: 2026-10-28; filed 2026-10-28. Security: Common Stock. Reported classification: P-Purchase.
Ali Wajid (director) reported a purchase in TTMI. Reported shares: 5,000; reported transaction value: $449,285.5. Transaction date: 2026-10-28; filed 2026-10-28. Security: Common Stock. Reported classification: P-Purchase.
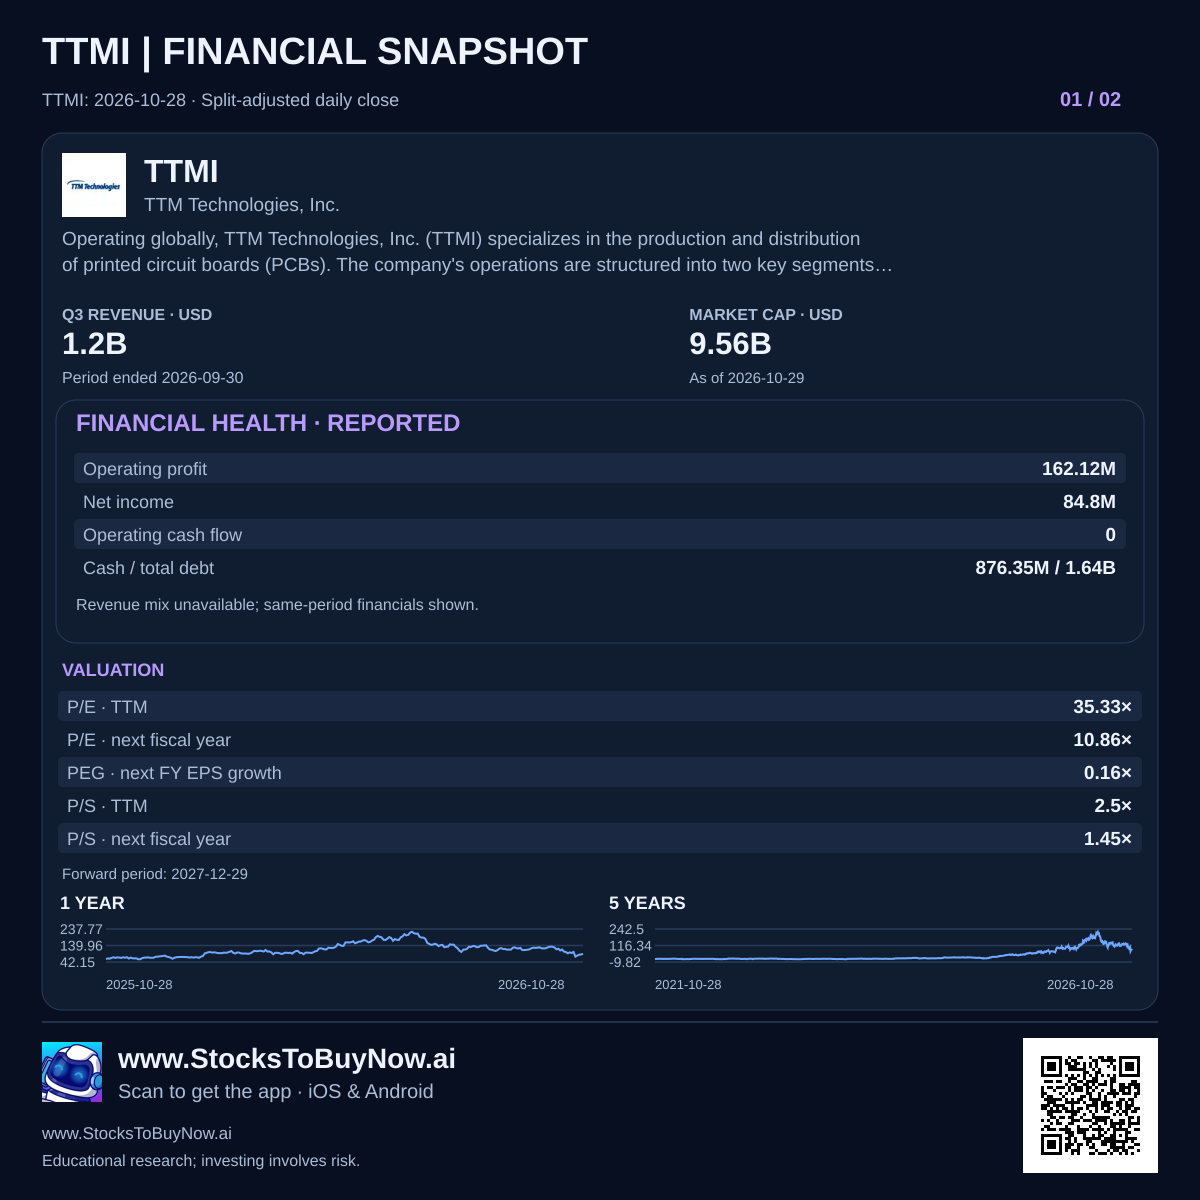
Financials
Company profile classification: Technology / Hardware, Equipment & Parts.
For Q3 2026, period ended 2026-09-30, reported revenue was USD 1,203,855,000 and net income was USD 84,803,000; diluted EPS was 0.79. Same-period operating cash flow: USD 0. Cash and cash equivalents: USD 876,347,000; total debt: USD 1,643,872,000. These are reported period figures, not current cash balances.
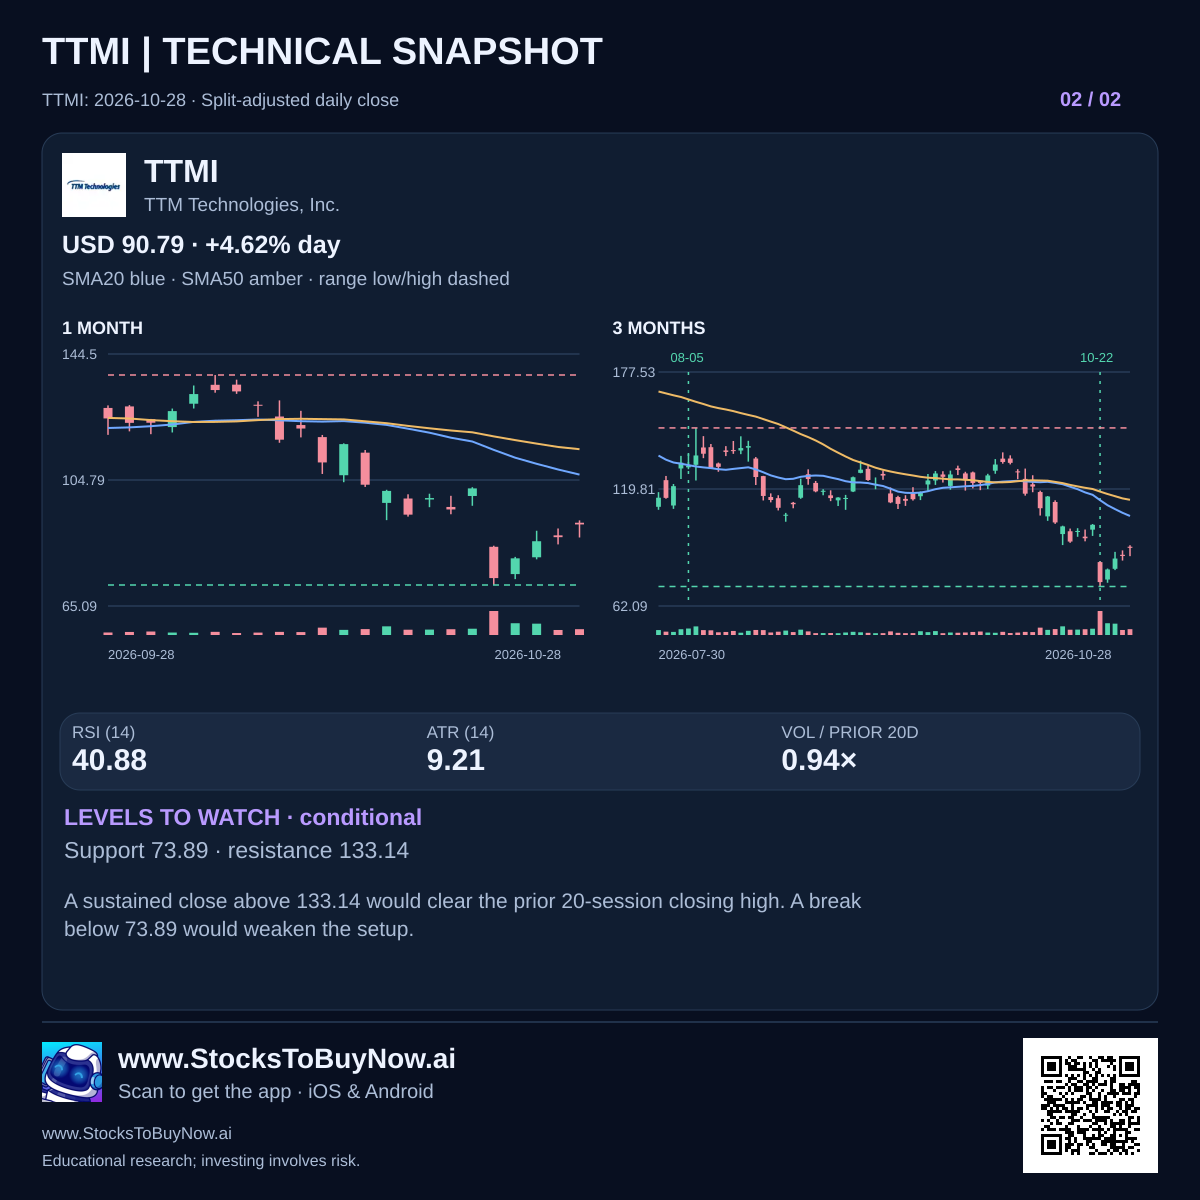
Technicals
The completed close on 2026-10-28 was USD 90.79 (Split-adjusted daily close). SMA20: 106.49; SMA50: 114.49; SMA200: 128.28. RSI14: 40.88; ATR14: 9.21; volume versus the prior 20-session average: 0.94 times. Prior 20-session closing support: 73.89; resistance: 133.14. A sustained close above resistance would clear that dated range; a break below support would weaken the setup. These are conditional observations, not price targets.
Earnings context
The saved earnings-history release date is 2026-10-22, with provider-reported EPS of 1.46. The consensus accounting basis has not been independently matched, so no EPS beat or miss claim is made. No upcoming earnings date is verified in the saved calendar.
Risks and coverage
Reported purchases do not prove investment intent or predict returns. Review operating losses, financing needs, corporate events, liquidity and the original filing footnotes alongside the charts. Fund comparisons use quarter-end share holdings, not known trade execution dates. Congressional amounts are ranges. Coverage is limited to the saved feeds; other disclosures may exist. Missing supplementary figures remain unspecified.
Read the original filings
Educational disclosure research. Purchases and holding changes are evidence for further research, not recommendations or predictions. Editorial standards · Sources and coverage